In a recent post I talked about the different methods astronomers use to measure the distances to the stars, and how the parallax method is probably the most important of all of these as it is one of the few true measures of distance.
Parallax relies on being able to measure the precise positions of the stars on multiple occasions so that their changing positions can be measured as the Earth orbits the Sun. Measuring the positions of stars is known as astrometry, and represents an entire branch of astrophysics. Making precise position measurements is incredibly difficult and is possible using only the most advanced telescopes on Earth, and this is only possible for stars in small areas of the sky at a time.
To measure parallaxes for stars across the entire sky requires a dedicated space telescope designed to make the most precise positional measurements of as many stars as possible. The telescope designed to do this is Gaia, the European Space Agency's (ESA) current flagship mission.
Gaia has been 20 years in development, planned since the final days of it's predecessor, the Hipparcos satellite, which measured the positions of the brightest 100,000 stars in the sky. It represented a giant leap forward in astrophysics, providing accurate distances for a large number of stars for the first time, but in some respects it barely scratched the surface of our galaxy.
Our Galaxy is approximately 100,000 light years across and contains roughly 100 billion stars. While Hipparcos was revolutionary, it observed only a fraction of the stars in our galaxy out to distances of only about 3000 light years. Gaia's goal is to surpass this and provide the first detailed, structural map of our entire galaxy.
Gaia will achieve this by imaging the entire sky repeatedly, approximately 70 times over the 5 year mission of the satellite. With each scan the satellite will record the positions of all the stars it observes, allowing scientists on Earth to measures the parallaxes and therefore the distances to all these stars.
But Gaia doesn't just measure the parallax towards these stars but also their motion across the sky, known as their proper motion. The stars in the sky are not fixed, but constantly moving and Gaia can measure these movements using the images it takes over the satellite's lifetime.
In fact Gaia needs to measure both the proper motion and the parallax of the stars because when the two are combined they cause the stars to follow a unique apparent motion across the sky. The figure below shows this. On the left you can see the positions of the stars that you might see from a single image of the night sky. Add in their motions across the sky (their proper motions) and the stars will follow straight paths (shown in the central panel), but then add in the parallax effect and the stars will appear to trace out loops across the sky (see the right-hand panel).
The complicated paths traced by the stars are the reason Gaia needs to perform so many astrometric measurements, allowing scientists to separate the motions due to parallax and proper motion.
The Gaia satellite was launched in December 2013 on a Soyuz rocket from ESA's launch site in French Guiana, the Guiana Space Centre. After a successful launch the satellite was manoeuvred to its designated orbital position, known as L2.
Once the satellite's mission is over scientists will be able to determine the parallaxes and proper motions of approximately 1 billion objects, as well as other useful information such as their colours and some spectroscopic information.
This detailed and important information, for so many stars will revolutionise astronomy. For the first time we will be able to map out the 3-dimensional structure of our Galaxy and we'll finally know the true distances to so many interesting astronomical objects (including star clusters!), allowing us to know where they are in our Galaxy, how they're moving, and how luminous they are.
I'm sure I'll be posting more news and information about Gaia in the future, so stay tuned!
Parallax relies on being able to measure the precise positions of the stars on multiple occasions so that their changing positions can be measured as the Earth orbits the Sun. Measuring the positions of stars is known as astrometry, and represents an entire branch of astrophysics. Making precise position measurements is incredibly difficult and is possible using only the most advanced telescopes on Earth, and this is only possible for stars in small areas of the sky at a time.
To measure parallaxes for stars across the entire sky requires a dedicated space telescope designed to make the most precise positional measurements of as many stars as possible. The telescope designed to do this is Gaia, the European Space Agency's (ESA) current flagship mission.
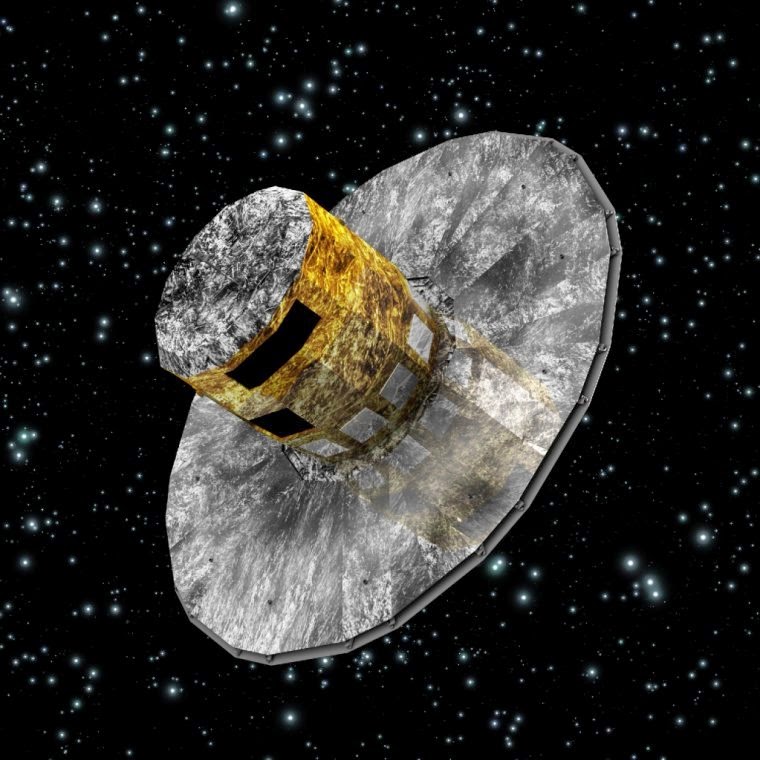 |
| An artist's impression of ESA's Gaia Satellite (Credit: ESA) |
Our Galaxy is approximately 100,000 light years across and contains roughly 100 billion stars. While Hipparcos was revolutionary, it observed only a fraction of the stars in our galaxy out to distances of only about 3000 light years. Gaia's goal is to surpass this and provide the first detailed, structural map of our entire galaxy.
Gaia will achieve this by imaging the entire sky repeatedly, approximately 70 times over the 5 year mission of the satellite. With each scan the satellite will record the positions of all the stars it observes, allowing scientists on Earth to measures the parallaxes and therefore the distances to all these stars.
But Gaia doesn't just measure the parallax towards these stars but also their motion across the sky, known as their proper motion. The stars in the sky are not fixed, but constantly moving and Gaia can measure these movements using the images it takes over the satellite's lifetime.
In fact Gaia needs to measure both the proper motion and the parallax of the stars because when the two are combined they cause the stars to follow a unique apparent motion across the sky. The figure below shows this. On the left you can see the positions of the stars that you might see from a single image of the night sky. Add in their motions across the sky (their proper motions) and the stars will follow straight paths (shown in the central panel), but then add in the parallax effect and the stars will appear to trace out loops across the sky (see the right-hand panel).
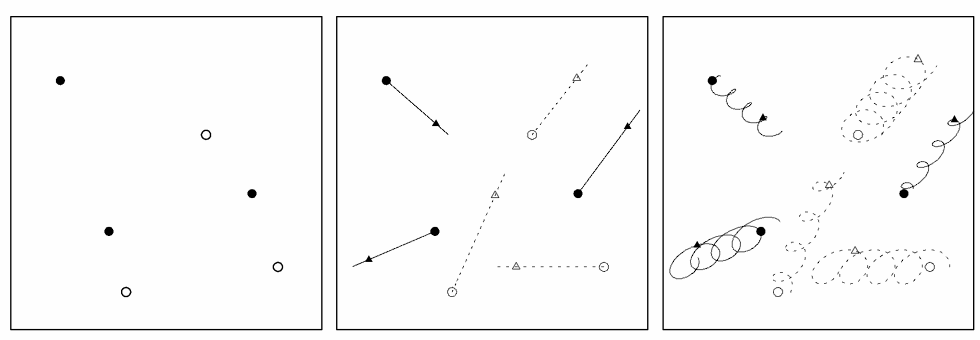 |
| The apparent motions of the stars built up from their positions (left), proper motions (centre) and parallaxes (right) (Credit: Wikipedia) |
The complicated paths traced by the stars are the reason Gaia needs to perform so many astrometric measurements, allowing scientists to separate the motions due to parallax and proper motion.
The Gaia satellite was launched in December 2013 on a Soyuz rocket from ESA's launch site in French Guiana, the Guiana Space Centre. After a successful launch the satellite was manoeuvred to its designated orbital position, known as L2.
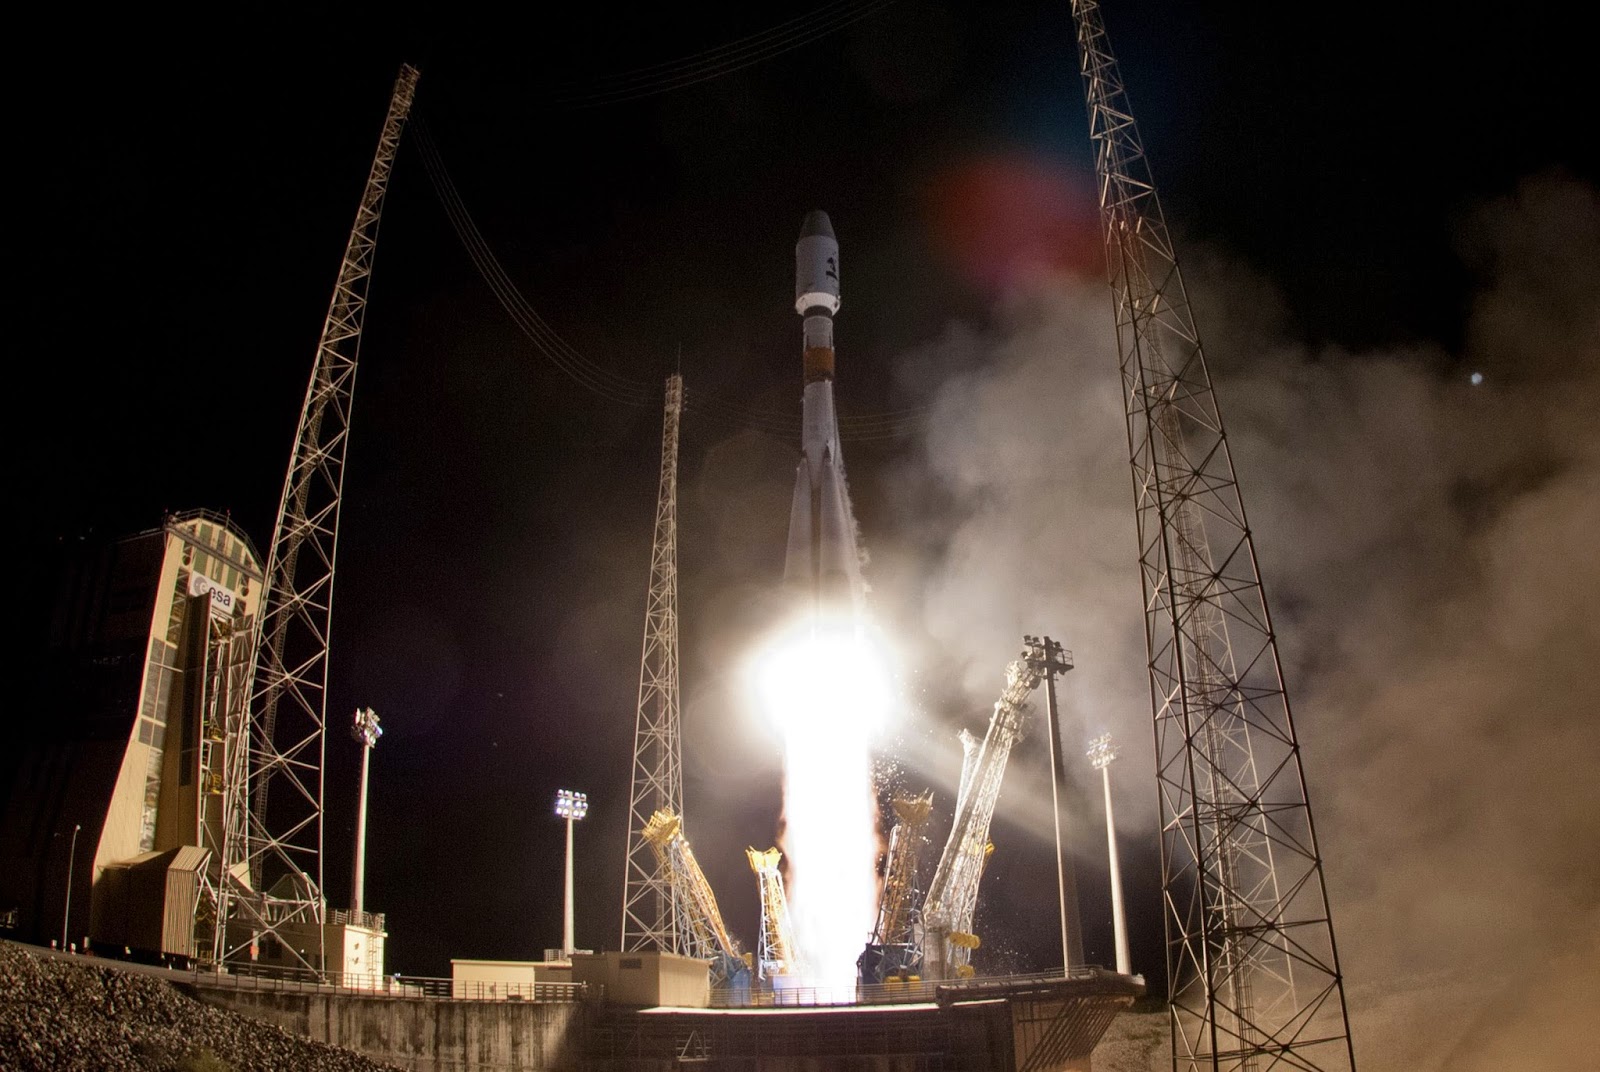 |
| Gaia's launch aboard a Soyuz rocket (Credit: Japan Times) |
Once the satellite's mission is over scientists will be able to determine the parallaxes and proper motions of approximately 1 billion objects, as well as other useful information such as their colours and some spectroscopic information.
This detailed and important information, for so many stars will revolutionise astronomy. For the first time we will be able to map out the 3-dimensional structure of our Galaxy and we'll finally know the true distances to so many interesting astronomical objects (including star clusters!), allowing us to know where they are in our Galaxy, how they're moving, and how luminous they are.
I'm sure I'll be posting more news and information about Gaia in the future, so stay tuned!


