Showing posts with label Milky Way. Show all posts

Monday, 24 August 2015

Why is there a giant ring of young stars surrounding us?

A few weeks ago I talked about one of the nearest (and most important) regions of star formation, the Taurus Molecular Cloud. This region however isn't alone in being a relatively nearby region of star formation, in fact it forms part of a group of such regions that circles us in the night sky and which is known as the Gould Belt.

The Gould Belt is a ring of nearby star forming regions and young star clusters that surrounds our Sun. It was first observed by John Herschel (son of the famous William Herschel who discovered infrared radiation), who noted it as a band of bright stars that circled the sky, tilted away from the plane of the Milky Way, which also circles the night sky.

The bright stars of the Scorpius-Centaurus OB association,
part of the Gould Belt of young stars and star forming regions
(Credit: Akira Fujii)
The belt was named after an American astronomer called Benjamin Gould who performed the first detailed study of the structure in the 1870s. Gould was a pioneering and prominent astronomer, the first American to earn a doctorate in astronomy, and would go on to found the Astronomical Journal, one of the most prominent astrophysical journals in the world.

In the early 20th century astronomers were able to use spectroscopy to measure the speeds of the stars in the belt and found that they were moving with similar motions. This meant that all the stars in the Gould Belt were part of a single coherent structure. The distinctive pattern of the stellar motions has also revealed that the belt is both expanding and rotating. The rotation of the belt is thought to be caused by the fact that it sits embedded within the Milky Way galaxy, which is itself rotating as well.

The system appears to be broadly flat and pancake-shaped, approximately 2000-3000 light years across, but only about 400-500 light years thick. There is also evidence that the belt isn't perfectly circular and is more oval-shaped, a distortion that is also thought to be due to the rotation of the Milky Way as it stretches and twists the belt.

Illustration of the Gould Belt across the night sky relative to the distribution of molecular clouds in our galaxy. The Gould Belt is shown in red and the Galactic Plane is shown in blue. (Credit: Nick Wright / Thomas Dame)

The discovery of molecular clouds of hydrogen gas in the second half of the 20th century revealed that the Gould Belt was made up of many such clouds. When it was later realised that such clouds were where stars form it was quickly recognised that the Gould Belt represented a major site of star formation. It is now known that these star-forming molecular clouds make up most of the mass of the Gould Belt. This includes many well known structures such as the Taurus Molecular Cloud, the Orion Nebula, and the Rho Ophiuchi cloud complex.

While there are still many stars forming in the Gould Belt there is also a considerable history of star formation dating back almost 60 million years. This has lead to a huge collection of young star clusters (such as the Pleiades and Alpha Persei clusters), many OB associations (the famous Scorpius-Centuaurus association amongst others), and a number of luminous supergiant stars (such as Antares, the bright red star in the constellation of Scorpius). Supergiants are massive stars that are coming to the ends of their short lives and these objects were most likely born in one of the star forming regions in the Gould Belt. In fact the Gould Belt includes the majority of massive stars in the solar neighbourhood.

The young star clusters and OB associations that make up the Gould Belt,
shown in 3D relative to the plane of the Milky Way.
(Credit: New Scientist)

Since the discovery of the Gould Belt astronomers have been trying to understand how such a large and coherent structure formed within our galaxy. It was first thought that it formed when a massive star exploded as a supernova. The shock wave from the supernova would have swept up huge clouds of gas, compressing them and triggering the formation of new stars within them. However, if this were the case the ring should be aligned with the Galactic Plane and not pointing out of the plane (as the above image shows), so this theory appears to be ruled out.

A recent suggestion is that the Gould Belt was produced when a massive cloud of gas collided with our galaxy, in the same way that dwarf galaxies are known to collide with our Milky Way galaxy. This collision would have lead to a giant ring of expanding gas in the Milky Way that would be inclined at the same angle to the Milky Way of the collision itself. The shock wave from this would lead to the triggering of star formation and the creation of young star clusters, just as in the structure we see today.

This theory represents the best explanation astronomers have for the Gould Belt at this present time. Recently weight was added to this theory when astronomers found evidence for similar structures to the Gould Belt in other galaxies, suggesting that this phenomena may not be that rare.

The Gould Belt is just one of many structures in our galaxy that we can observe, from local star-forming clouds up to massive spiral arms. Understanding how these structures relate to the continual process of star birth and death and the evolution of our galaxy is one of the major tasks for astronomers today. Next time you look up at the night sky and see the bright stars and star clusters that are part of the Gould Belt think of how these objects are a part of the continual evolution of our galaxy!

Wednesday, 12 August 2015

Tracing the spiral arms of the Milky Way

Our galaxy, the Milky Way, is thought to be a huge spiral galaxy like many such galaxies we see across the Universe. One of the tasks that modern-day astronomers are trying to achieve is to map the size and structure of our galaxy so we can better understand how it formed and how it will evolve in the future.

The spiral galaxy Messier 100 - similar to our own Milky Way? (Credit: ESO)

One of the key tasks in such work is to map the spiral arms of our galaxy. This is important because spiral arms are thought to be where the majority of dense gas is found in galaxies, and therefore where the majority of star formation takes place. Spiral arms aren't fixed objects though, the stars in our galaxy actually move in and out of the spiral arms as they orbit within our galaxy. Spiral arms are actually thought to be density waves that rotate around our galaxy, independently of the stars in our galaxy, just like waves in the ocean move independently of the water in them.

Spiral arm model of the Milky Way with four arms.
The Sun is located towards the top of this image.
(Credit: Georgelin & Georgelin 1976)
Identifying spiral arms is easy when you're outside of a galaxy and looking at it face on, but its much harder when you're embedded within the galaxy and all you can see is the plane of our galaxy. We can't directly see the spiral arms of our galaxy, but we can trace their presence by looking for signposts that identify them. Signposts such as giant molecular clouds, star forming regions, and bright young stars are all indicators of where spiral arms are found.

The Milky Way was first identified as a spiral galaxy thanks to the work of William Morgan from Yerkes Observatory who showed that the distribution of bright and hot OB stars, which are known to be very young objects, appear to be distributed in spiral arms. Morgan identified three spiral arms, which he labelled the Perseus, Orion and Sagittarius arms.

Later studies that attempted to discern the spiral structure of the Milky Way used the radio emission from hydrogen gas to trace its structure, but it can be tricky to determine the distance to such gas, making it hard to reveal the 3-dimensional structure.

A major breakthrough came in the 1970s when scientists combined radio measurements of hydrogen gas with optical measurements of the distances to the young stars associated with the gas. This work lead to a model made up of four spiral arms called the Norma, Scutum-Centaurus, Sagittarius and Perseus arms. While many researchers debated the distances to the various star forming regions used for this model (and therefore the exact structure and number of spiral arms the model predicted), this picture was for over 30 years the standard model of the spiral structure of the Milky Way.

The model changed again in 2008 thanks to data from NASA's infrared Spitzer Space Telescope, which allowed astronomers to count the number of stars all the way across our galaxy. The number of stars they counted suggested that there weren't four spiral arms, but only two, with a number of smaller spiral arms lying in between them.

Artist's conception of our new view of the Milky Way's structure thanks to results from the Spitzer Space Telescope.
The Sun's position is marked towards the bottom of this image.
(Credit: NASA)
This new model suggests that the Perseus and Scutum-Centaurus arms are the two major arms, while the Norma and Sagittarius arms are actually relatively minor arms. The two major arms connect up with the inner Galactic Bar, which dominates the central part of our Milky Way and may also play a role in the origin of the spiral arms.

Recently a flurry of results have taken this work even further with suggestions of a new and distant spiral arm that wraps completely around one side of the galactic centre, while other researchers have started using the distribution of star clusters to trace the structure of the Milky Way. Further improvements in the model of our galaxy's structure have come thanks to improved distance estimates for many of the stars and clusters in our galaxy, allowing the exact size and extent of the galaxy to be better determined.

Upcoming missions such as the Gaia observatory that will determine the distances to a billion stars across our galaxy will dramatically improve our understanding of our galaxy's size and shape. The motions that the Gaia spacecraft will measure will allow astronomers to study the orbits of these stars as well, improving our understanding of our galaxy from a purely structural model to a more advanced dynamical model.

Monday, 30 March 2015

Milky Way Astrophysics from Wide Field Surveys - Part I


The entrance to the Royal Astronomical Society's
headquarters at Burlington House in London
(Credit: Wikimedia Commons)
This week I'm at a conference in London at the headquarters of the Royal Astronomical Society where we're discussing scientific results from recent wide field surveys of the Milky Way. Wide field surveys is just another name for surveys that cover a large area of space, and there are many surveys these days that fit that category, including a few that I work on.

Because these surveys cover such a large area of space they allow many different types of astronomical objects to be studied, from young stars to old stars, individual objects to the entire galaxy. So a conference like this is a great opportunity to stay in touch with a wide array of scientific results.

Today's talks have mostly been given by the leaders of the surveys, who have been telling us about their surveys, how we can get the data from the surveys, and highlighting some of the scientific results. This is a good opportunity to learn about new survey data and to think about how this data might be useful to solve some of the problems I'm trying to address.

The Milky Way - home of many many surveys! (Credit: ESO)

I've been really impressed with the surveys presented today. They've covered (almost) every part of the electromagnetic spectrum, from radio waves through the infrared and up to the optical part of the spectrum, and they've offered up a huge range of possibilities for future work. They also have some amazing names, including such gems as e-MERLIN and UWISH - astronomers really love acronyms!

The highlight of the day for me was probably a presentation about a sub-mm survey called ATLASGAL. The sub-mm part of the electromagnetic spectrum is between the infrared and the microwave parts of the spectrum. One of the advantages of observing in this part of the electromagnetic spectrum is that it is not absorbed by dust and so can be used to study objects across our entire galaxy, even on the far side of our galaxy that would normally be obscured and inaccessible to us.

Part of the Galactic Plane of our galaxy seen by the ATLASGAL survey showing a number of prominent
star forming regions, including Messier 20, The Triffid Nebula (Credit: ESO/ATLASGAL)

The survey data has been used by a team of astronomers to survey the majority of our galaxy in the sub-mm part of the spectrum and identify hundreds of dense clumps of molecular gas where massive stars are forming. Sub-mm emission is one of the most reliable and efficient methods to identify dense star forming regions. It's an exciting project and I'm looking forward to seeing more results from the survey in the future.

Thursday, 13 November 2014

How our galaxy absorbs other galaxies


I want to take a break from talking about star clusters today to discuss something on a much larger scale: our galaxy! This is motivated by a visit yesterday from Dr Vasily Belokurov from Cambridge University who gave an excellent seminar on the size and structure of our galaxy from studies of how our galaxy grows.

Large galaxies like our Milky Way galaxy can grow by absorbing smaller dwarf galaxies. These dwarf galaxies are common in the Universe and when they get close to a massive galaxy like ours they are drawn towards it by gravity and begin to orbit the larger galaxy (they're often called satellite galaxies at this point).

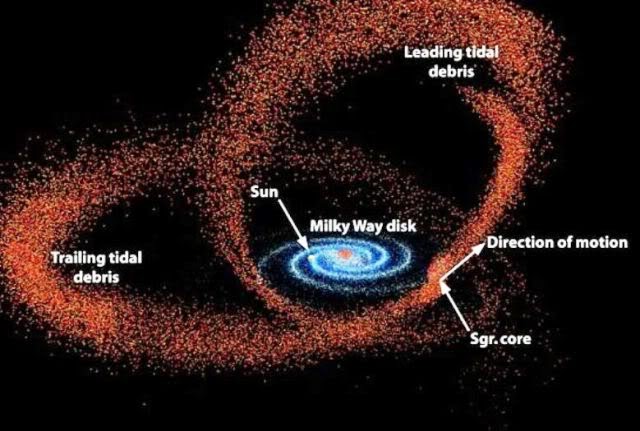
When these small galaxies get really close to the large galaxy they begin to be disrupted by the gravitational force from the larger galaxy and can actually be torn to shreds, scattering the stars in the dwarf galaxy out into long tidal streams, as shown in the image below.

Tidal streams caused by orbiting satellite galaxies (Credit: David Law)

This process can take millions of years while the dwarf galaxy orbits and falls into the larger galaxy. This creates patterns of huge tidal streams emanating from these satellite dwarf galaxies and which encircle our own galaxy.

A famous example of this is the Sagittarius dwarf galaxy, which is about 82,000 light years from us and in the process of being stripped apart as it orbits the Milky Way. We can see this as a huge stream of stars that circles the sky known as the Sagittarius tidal stream. The image below shows this stream (and other streams) using data from the Sloan Digital Sky Survey - which we talked about in a previous post. The Milky Way will one day consume this galaxy entirely, absorbing all of its stars into the halo of our galaxy.

The Sagittarius Tidal Stream as seen in SDSS data (Credit: Vasily Belokurov)

Dr Belokurov studies tidal stream such as this to infer the large-scale structure of our galaxy. Because we are inside our galaxy it can be hard to determine it's full size and spatial extent, so this can be difficult work. This approach is kind of like inferring the structure of a city by tracing the motions of cars entering the city - even if you don't know where the buildings and places of interest are, you would be able to estimate where they are and how the city is structured by the motions of cars into and around the city. This is exactly what Dr Belokurov does, only by using the positions and motions of tidal streams he can infer the structure of the galaxy!

Sunday, 19 October 2014

The largest astronomical catalogs ever made! (Part II of II)

In a previous post I introduced the 'Top 10' largest astronomical catalogs that are currently and publicly available for astronomers (and anyone) to download and use. For a quick reminder, here's the list:
  1. The US Naval Observatory (USNO-B1) all-sky catalog, 1046 million entries (2003)
  2. The Guide Star Catalog (GSC v2.3) all-sky catalog, 946 million entries (2006)
  3. The Sloan Digital Sky Survey (SDSS DR9), 933 million entries (2012)
  4. The Wide-field Infrared Survey Explorer (WISE) all-sky catalog, 748 million entries (2013)
  5. The United Kingdom Infrared Deep Sky Survey (UKIDSS), 727 million entries (2012)
  6. The 2 Micron All Sky Survey (2MASS), 471 million entries (2003)
  7. The Deep Near Infrared Survey (DENIS) of the southern sky, 355 million entries (2005)
  8. The INT Photometric H-Alpha Survey (IPHAS), 219 million entries (2014)
  9. The USNO CCD Astrograph Catalog v4 (UCAC4), 114 million entries (2012)
  10. The Galactic Legacy Infrared Mid-Plane Survey (GLIMPSE), 104 million entries (2008)
In that post I discussed five of these surveys (including the IPHAS survey that I work on - read more about that here) that all include astronomical objects observed in the visible part of the electromagnetic spectrum (that is the part that we can see with our own eyes). The other five of these surveys all include measurements made outside of this part of the spectrum, and its those I'd like to talk about today.

The electromagnetic spectrum, with wavelength increasing to the right, and frequency (or energy) increasing to the left. (Credit: NASA)

These five surveys are WISE, UKIDSS, 2MASS, DENIS, and GLIMPSE, and they're all infrared photometric surveys, which means they measure how bright astronomical sources are in the infrared. The infrared part of the electromagnetic spectrum includes radiation with a longer wavelength than that of the light we can see, though not as long as microwave radiation or radio waves. You may be aware that infrared radiation is what we commonly know of as heat or warmth. Any object with a temperature around body temperature or up to a few hundred Celsius will radiate energy in the infrared.

Astronomers often divide up the infrared part of the electromagnetic spectrum into the near-, mid- and far-infrared regions, ordered by how far they are from the visible part of the spectrum. The definition of these three regions isn't important, but originates in the different technologies required to detect radiation in each region (such as different CCD detectors).

The near-infrared is the most easily accessible part of the infrared spectrum, and three of these surveys cover this region. Perhaps the most commonly-used of these is 2MASS, an all-sky near-infrared survey, which operated from 1997 to 2001 at two observatories in Arizona and Chile. The 2MASS all-sky view of the Milky Way is a stunning panorama of our galaxy, aided by the ability of near-IR radiation to penetrate the dust that would otherwise absorb optically visible radiation.

The 2MASS all-sky view of the Milky Way (Credit: IPAC)

The DENIS survey was also a deep near-IR survey that finished in 2001, but which only covered the southern sky. The UKIDSS survey(s) are a series of very deep near-IR surveys (deeper than both 2MASS and DENIS) on the United Kingdom Infra-Red Telescope (UKIRT) in Hawaii that targeted certain areas of the sky for different science goals. Some of these areas include regions of our galaxy where stars are forming and other areas look away from our galaxy out into the darkest regions of space where other galaxies are easily studied.

The remaining two surveys, WISE and GLIMPSE, are mid-infrared surveys, operating at slightly longer wavelengths than the near-IR surveys.

The centre of our Milky Way galaxy seen in the mid-infrared from GLIMPSE (Credit: Spitzer GLIMPSE team)

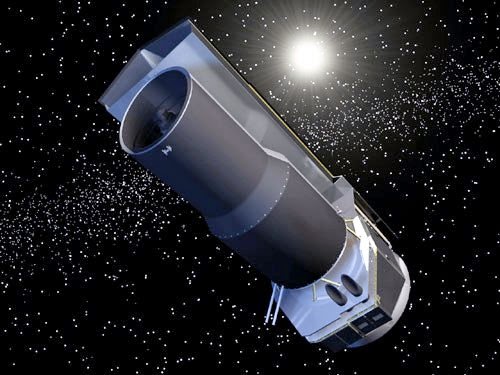
GLIMPSE was a survey of the Milky Way galaxy with NASA's Spitzer Space Telescope, and WISE is also a NASA space telescope that performed an all-sky infrared survey. Because the Earth's atmosphere absorbs most mid-infrared radiation, mid-infrared telescopes have to operate from above the atmosphere.

An artist's impression of NASA's
Spitzer Space Telescope in orbit
(Credit: IPAC)
A further complication for mid-infrared telescopes is that the telescopes themselves have to be cooled to very low temperatures to prevent them from radiating infrared photons themselves! This is because, even in space objects will radiate infrared radiation depending on their temperature. These photons would contaminate the measurements made, and so the entire telescope has to be cooled to incredibly low temperatures, much lower than anything in our solar system, to prevent them from radiating significantly large amounts of infrared radiation. Both space telescopes used cryostats filled with liquid hydrogen to achieve this, allowing them to be cooled to less than -263 C (under 10 K).

That brings our list of the largest astronomical catalogs to a close, for the time being at least. Astronomy is moving ever so rapidly towards bigger and bigger catalogs and it is almost certain that these catalogs will be eclipsed in the near future. The most likely candidates to take the throne of largest astronomical catalog will probably come from either ESA's Gaia satellite or the Large Synoptic Survey Telescope (LSST). More on these in a future post!

Tuesday, 30 September 2014

A new catalogue of over 200 million stars in the Milky Way galaxy

Recently one of the surveys that I'm a member of made a huge data release including over 200 million stars from our own galaxy, the Milky Way. We've made the data available to the entire world, not just the astronomical community, but everyone in the world! Astronomers love to share data!

The Isaac Newton Telescope on La Palma (Credit: ING)

The survey in question is the INT Photometric H-Alpha Survey (IPHAS), which has, over the last 11 years been using the Isaac Newton Telescope on the island of La Palma to survey our own galaxy to an unprecedented level of detail.

IPHAS is a photometric survey, meaning the goal of the survey is to measure photometry for all the sources it observes (astronomers refer to most objects as 'sources' until they're sure exactly what they are: stars, planets or galaxies). Photometry is the easiest measurement astronomers can make, since all you have to do is measure how bright an object is using a certain filter. IPHAS uses two 'broad' filters and one 'narrow' Hα filter (more on the awesomeness of this filter and what you can do with it in a future post).

The Milky Way (Credit: Wikimedia Commons)
Our own galaxy is visible to us as a glowing band of light stretching across the sky, known as the Milky Way. It appears this way to us because we (the Earth, the Sun and the entire solar system) are within the galaxy, and so we see the galaxy all around us, but concentrated in a band of light that makes up the disk of our galaxy. Astronomers refer to this as the Galactic Plane.

Surveying our galaxy is not easy because the stars can often be very crowded together (hence why they often appear blurred as a bright band of light instead of individual stars), so to do the job properly requires a high-resolution telescope and instrument, but also one that could invest a lot of time and effort into a single project such as this.

In 2003 the Isaac Newton Telescope was just such a telescope and so the IPHAS collaboration was born, led by Janet Drew (currently at the University of Hertfordshire where I am also based). I joined the collaboration in 2004 when I started my PhD at University College London and have been involved in the survey ever since, participating in the telescope observations, analysing data, and writing papers. Its been great to be involved in such a large and exciting project such as this.

After 11 years of taking data, sorting and organising the data, and doing some exciting science as well, the catalog is finally finished. It contains information on 219 million detected objects, the vast majority of which are stars in our own galaxy. It's an example of what astronomers (and data scientists) refer to as 'big data': huge catalogs of data, observations and measurements that can be sorted, filtered and analysed en masse.

One example of this is the image shown below, which was put together by IPHAS astronomer Hywel Farnhill. This map shows part of the Galactic Plane that IPHAS has been surveying, mostly covering the constellation of Cygnus, but stretching to Sagitta on the right.

IPHAS stellar density map (Credit: Hywel Farnhill)

This map is a stellar density map, showing the density of stars across the Galactic Plane, i.e. the number of stars detected by the IPHAS survey in each area of the plane, and its really detailed! Click here to see a high-resolution version of the image, zoom into it, and have a look at the exquisite level of detail that can be seen. The brightest parts are where we detect the most stars and the darkest parts are where we detect the least stars.

Most of this structure is actually due to the obscuring effects of interstellar dust, and not actually the distribution of stars in our galaxy (though this does contribute). Interstellar dust, which is mostly very small silicate rocks (similar to those found on Earth), absorbs starlight, particularly at visible wavelengths, and leads to the fine structure that you can see in this image. Tracing the distribution of this dust is really important to astronomers because of the huge influence it can have when it absorbs the light from the stars and galaxies we are trying to study.

You can read more about the survey on the IPHAS website, learn about the data release itself in this published paper by IPHAS astronomer and catalog maestro Geert Barentsen, or read the press release from the Royal Astronomical Society. If you'd like to access the data (and please do) you can get the entire set of data, for free, from the Vizier web archive.