Monday 22 December 2014

Globular Clusters: the grandaddies of all clusters

This week I heard a fascinating talk about globular clusters, so I wanted to take this opportunity to tell you about globular clusters, and some of the science being done to study and better understand these amazing astronomical objects.

Globular clusters are a type of star cluster, but they're a very special type of star cluster, partly because they're very massive, but also because they're very old, almost as old as the Universe itself. For this reason they provide a glimpse of how stars, and star clusters, formed a long time ago.


The Omega Centauri globular cluster, the largest in
our galaxy (Credit: ESO)
Globular clusters are huge and contain millions of stars, considerably more than other types of star cluster. Although there are no fixed boundaries for the size of a globular cluster, they typically contain between 100 thousand and a few million stars, though there are some even larger than this.

The largest globular cluster in our galaxy is Omega Centauri, which is thought to contain approximately 10 million stars. Though it is quite distant it is relatively bright and can be seen with a pair of binoculars, as can many of the other globular clusters in our galaxy.

In addition to being massive, globular clusters are also very old. The ages of globular clusters can be determined by studying how the stars in the cluster have evolved based on our understanding of stellar evolution (the study of how stars evolve). The globular clusters in our galaxy seem to be about 11-13 Gyr old (1 Gyr = 1000 million years). This is just younger than the approximate age of the Universe, 13.7 Gyr, suggesting globular clusters were some of the first objects to form in the Universe.

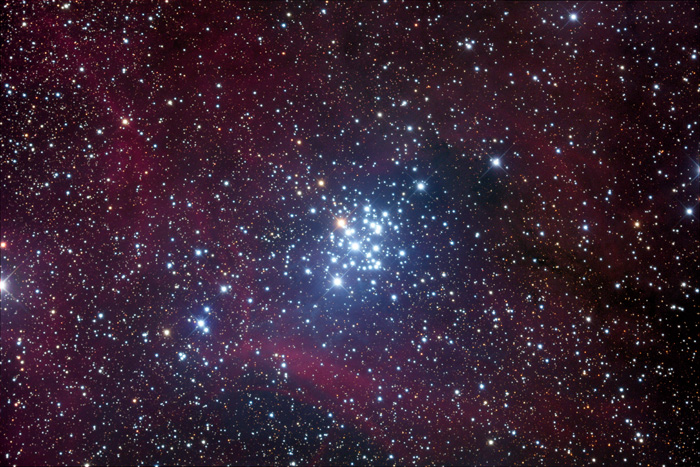
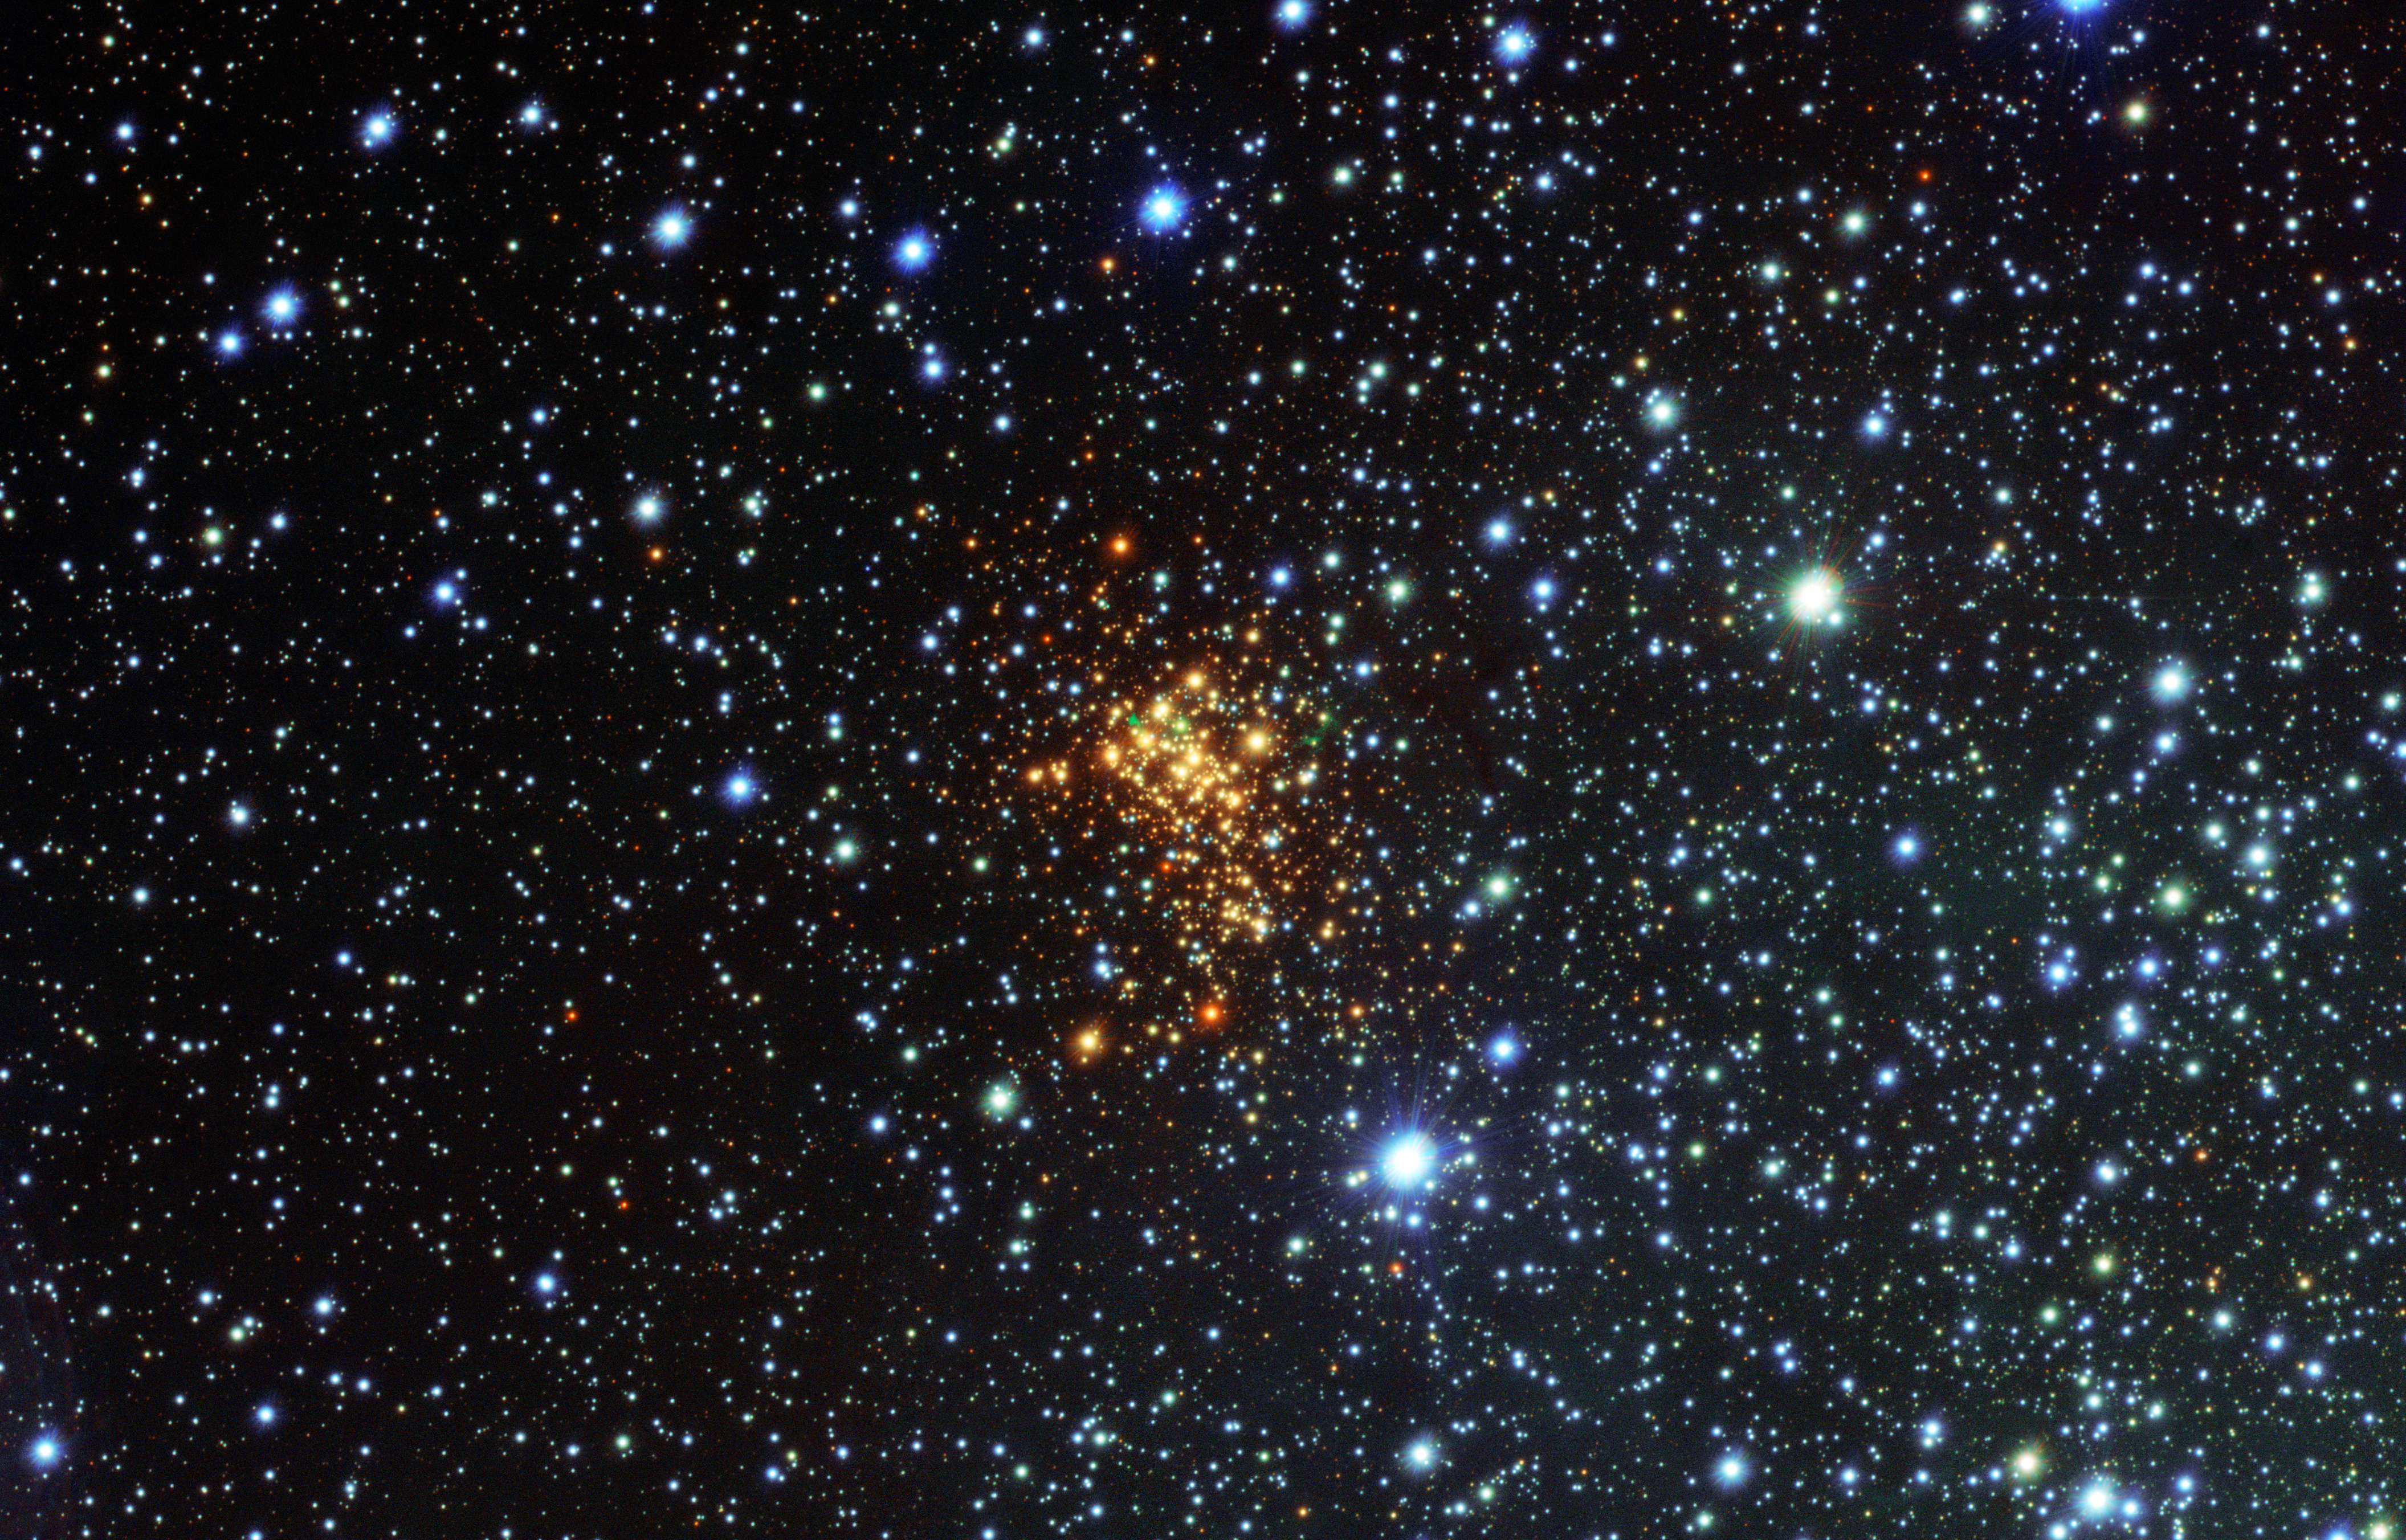
The M80 'Scorpio' globular cluster (Credit: Baran Observatory)

It is thanks to their old age that globular clusters are so round and spherical. Globular clusters are held together by the mutual gravitational attraction of all the stars in the cluster, and over time this gravitational attraction has smoothed out any small structural differences in the cluster and created an almost perfect ball of stars. In fact globular clusters are really useful for studying how gravity affects clusters of stars, simply because they've been around for so long and have been relatively undisturbed by the galaxy.

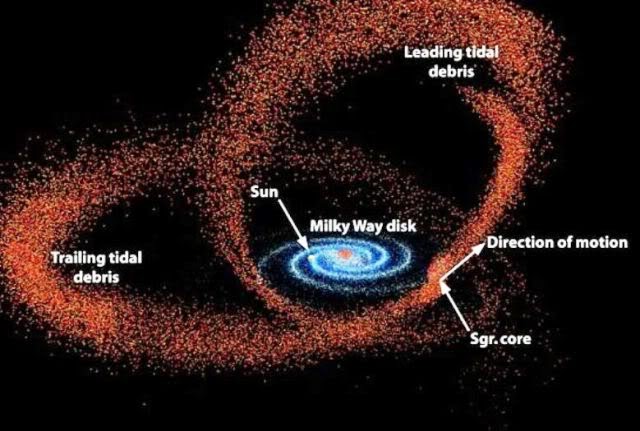
The reason globular clusters haven't been disturbed by the galaxy they reside within is because of where within the galaxy globular clusters are found. The oldest stars in our galaxy are found not in the disk of the Milky Way galaxy, but in its halo, which is a spherical and diffuse cloud of stars within which the disk of our galaxy sits. Globular clusters are as old as the oldest stars in our galaxy and are found distributed across the Galactic halo in relative isolation compared to the spiral-shaped disk of the galaxy.

The structure of our galaxy, showing the globular clusters in the Galactic halo (Credit: University of Oregon)

Our galaxy contains approximately 150 known globular clusters, with experts suggesting that there may be 10 to 20 still to be discovered. Because of their brightness we can identify globular clusters in other galaxies and some large galaxies have many more globular clusters than the Milky Way, for example the Andromeda Galaxy may have as many as 500 globular clusters!

One of the great mysteries of globular clusters is how they formed, whether they formed in a single burst of star formation or whether they are made up of multiple generations of stars. This also raises the question of whether globular clusters are significantly different from some of the smallest type of galaxy we know of, for example the dwarf spheroidal galaxies. All of these unanswered questions are very important for understanding how stars and galaxies form, which makes globular clusters an important area of astronomical research.

Thursday 11 December 2014

How far away is that star?

One of the simplest and yet most important questions in astronomy relates to how far away the objects we study are. This question is relevant to all astronomical objects, from stars to galaxies and beyond. It's important to understand how far away these objects are because that's how we know how large or how luminous they are, and knowing these characteristics is necessary to build up our model of the Universe.

Despite this, measuring distances in astronomy is incredibly difficult, because sometimes all that can be resolved about an object is a single dot of light. For this reason astronomers have built up a series of methods for estimating the distances to objects, each of which is used for different types of object at different distances, and with each method calibrated using one of the other methods. We refer to this as the distance ladder.

The Parallax Effect
(Credit: Wikipedia)
The most fundamental method to determine distance, and the most important step on the distance ladder, is known as parallax. Parallax is the effect by which objects at different distances change their apparent position based on your vantage point.

In astronomy this is possible because the Earth changes it's position throughout the year as it orbits the Sun. Because of this the apparent positions of stars relative to each other change throughout the year.

This diagram shows an example of this. When the Earth is on the opposite side of the Sun the line of sight to a nearby star will change relative to more distant stars. The apparent shift in the position of the nearby star is known as the parallax angle and is directly related to the distance to the star - the nearer the star is, the larger the parallax angle will be.

You can simulate a small-scale version of this process for yourself using your two eyes as the two different vantage points. Hold out your hand in front of your face with a single finger pointing vertically upwards. Close one eye and look at the scene in front of you. Then switch the eye that is closed and see how the scene in front of you changes. You should see that the position of your finger changes relative to the background scene it is projected against.

In this example your finger is the nearby star and the background scene is the background stars. If you try moving your finger closer or further away from your face you should see that the apparent shift in your finger's position when you switch your closed eye changes - does the shift get larger when your finger is closer or further away from you?

Because parallax is such an important method of distance determination it has led to the most commonly used unit of distance in astronomy, the parsec. A parsec (1 pc) is the distance at which an object's apparent position shifts by 1 second of arc (1/3600 of a degree) as the Earth orbits the Sun. It's a very small shift, but then a parsec is a very large distance - approximately 30,000,000,000,000 km!

Despite how big the parsec is, all the stars in the sky are actually more distant than a parsec, and many are much much further than this. Because of this astronomers need very precise instruments and telescopes to be able to measure the tiny changes that result from the parallax effect. One of the most famous such telescopes was the Hipparcos space telescope, which measured parallaxes for thousands of stars out to distances of several hundred parsecs. The Hipparcos telescope was one of the most important telescopes in astrophysics, simply because of the unprecedented accuracy with which it measured the distance to so many stars. The successor to Hipparcos, the Gaia space telescope, was launched about a year ago, and is continuing this mission as we speak.

The European Space Agency's Hipparcos satellite (Credit: CNES)

For very distant objects where the parallax method is not feasible the only way to determine distances is to estimate how intrinsically bright the object is and then determine its distance based on how bright it appears to us. To do this we need to use objects with a known, or predictable, brightness, often referred to as standard candles. Examples of this including pulsating stars such as Cepheid variables, which Edwin Hubble used to determine distances to other galaxies. This method is most commonly applied to distant galaxies that are too far away to use parallax, but close enough to resolve and study their individual stars.

Wednesday 26 November 2014

Surveys, surveys, surveys

I have been in Naples, Italy, this week for a conference about the many wonderful astronomical surveys that have been produced recently. The last decade has been a rich time for survey science, thanks in part to the pioneering surveys at the turn of the century (such as SDSS and 2MASS), but also to the work of new dedicated survey telescopes such as VST and VISTA. These large surveys have provided astronomers with huge samples of stars and galaxies with which to investigate many important aspects of how stars and galaxies form and evolve.

The European Southern Observatory's (ESO) facilities at Cerro Paranal,
including the VLT, VST and VISTA telescopes (Credit: Wikipedia)
It is with one of these telescopes, the VLT Survey Telescope (VST), that I have been using data from over the last few years for the VPHAS+ survey, the VLT Photometric H-Alpha Survey. This is the follow-up survey to IPHAS, the INT Photometric H-Alpha Survey, which I discussed in a previous post.

The VPHAS+ survey was actually the subject of the talk I gave at the conference today. I presented both an outline of the survey and some of the most exciting science results that have come out of the survey in recent years. It was quite an honour to present so much exciting science from across our survey collaboration, and I'm grateful to everyone in the survey who contributed to the work and helped me prepare the presentation. If you want to learn more you can watch my presentation on youTube here (my talk starts at 56:00).

This conference has been a great opportunity to learn both about surveys going on at the moment and some of the surveys planned for the future. As well as the traditional photometric surveys, there are now surveys designed to study how astronomical objects change over time by making repeat observations of the same areas of the sky. Some surveys are already doing excellent work in this area, such as the VVV survey (Vista Variables in the Via Lactae), but there are also some very exciting projects planned for the future, such as the Large Synoptic Survey Telescope (LSST).

Finally, there have been looks to the future of astronomical surveys and particularly the future spectroscopic surveys that will, instead of just measuring the brightness of sources in a few bands, actually take detailed spectra that can be used to determine the physical properties of the sources. The European Southern Observatory, ESO, has plans to convert one of its survey telescopes, VISTA, from being an imaging telescope to being a spectroscopic telescope. This is something that I really look forward to seeing and hopefully using. These are really exciting times for survey astronomy!

Thursday 13 November 2014

How our galaxy absorbs other galaxies


I want to take a break from talking about star clusters today to discuss something on a much larger scale: our galaxy! This is motivated by a visit yesterday from Dr Vasily Belokurov from Cambridge University who gave an excellent seminar on the size and structure of our galaxy from studies of how our galaxy grows.

Large galaxies like our Milky Way galaxy can grow by absorbing smaller dwarf galaxies. These dwarf galaxies are common in the Universe and when they get close to a massive galaxy like ours they are drawn towards it by gravity and begin to orbit the larger galaxy (they're often called satellite galaxies at this point).

When these small galaxies get really close to the large galaxy they begin to be disrupted by the gravitational force from the larger galaxy and can actually be torn to shreds, scattering the stars in the dwarf galaxy out into long tidal streams, as shown in the image below.

Tidal streams caused by orbiting satellite galaxies (Credit: David Law)

This process can take millions of years while the dwarf galaxy orbits and falls into the larger galaxy. This creates patterns of huge tidal streams emanating from these satellite dwarf galaxies and which encircle our own galaxy.

A famous example of this is the Sagittarius dwarf galaxy, which is about 82,000 light years from us and in the process of being stripped apart as it orbits the Milky Way. We can see this as a huge stream of stars that circles the sky known as the Sagittarius tidal stream. The image below shows this stream (and other streams) using data from the Sloan Digital Sky Survey - which we talked about in a previous post. The Milky Way will one day consume this galaxy entirely, absorbing all of its stars into the halo of our galaxy.

The Sagittarius Tidal Stream as seen in SDSS data (Credit: Vasily Belokurov)

Dr Belokurov studies tidal stream such as this to infer the large-scale structure of our galaxy. Because we are inside our galaxy it can be hard to determine it's full size and spatial extent, so this can be difficult work. This approach is kind of like inferring the structure of a city by tracing the motions of cars entering the city - even if you don't know where the buildings and places of interest are, you would be able to estimate where they are and how the city is structured by the motions of cars into and around the city. This is exactly what Dr Belokurov does, only by using the positions and motions of tidal streams he can infer the structure of the galaxy!

Sunday 9 November 2014

Talking about star clusters in Copenhagen

The absence of posts this week was because I've been taking a break from doing research at my desk and instead I've been at a conference to discuss research with other scientists studying star clusters. The conference was "The Early Life of Stellar Clusters: Formation and Dynamics" and was held in Copenhagen, Denmark, a really beautiful city.

Copenhagen, very pretty (albeit cold)

Conferences are important in science because they allow scientists distributed all over the world to come together and discuss the current state of research with other scientists. This can be particularly important if you work in a small field (such as astrophysics) where the world's experts are spread all around the world. There can be lots of debates and arguments, discussions with collaborators, as well as opportunities to start new collaborations with people you meet.

This meeting attracted about 50 people who all study different aspects of star clusters and who have come together to discuss them. Most of the attendees have given a presentation to the group, including myself (I gave my talk on the first day and was able to relax after that). I talked about my recent work on an OB association called Cygnus OB2 (more on that in a future post) and I think it was well received.

It was a great conference and I'm very grateful to the organisers for putting it together (and for giving me the opportunity to present my work!). The meeting has given me lots of ideas for future projects, has opened the door to future collaborations, and helped develop some existing projects. I'm looking forward to the next conference already!

Thursday 30 October 2014

The Lagoon Nebula

This week I've been studying a young star cluster known as NGC 6530, which is embedded within a famous region known as the Lagoon Nebula. This is one of the most famous nebulae in the sky, and a very attractive target for astrophotographers. Below you can see an image of the Lagoon Nebula that I made, and I think you'll agree that the nebula really does look very lagoon-like!

The Lagoon Nebula as imaged by VPHAS+ (Credit: Nick Wright)

The data for this image comes from the VPHAS+ survey (the southern-hemisphere counterpart to the IPHAS survey), which is being run from the European Southern Observatory's VLT Survey Telescope (the VST) in Chile. We compiled this data for ESO last year to help them with a press release, which they used to produce their own image that you can see here. Their image is nice, but I greatly prefer my own because I think we've retained the lagoon-like swirling clouds of gas much better than they have. What do you think?

The NGC 6530 cluster in the centre of the Lagoon Nebula
The Lagoon Nebula is interesting for astronomers like myself because it's a region where stars are actively forming, and you can even see a cluster of stars that have already formed in the centre of the nebula. This cluster, known as NGC 6530 is about 2 million years old (which is quite young for stars!) and contains many thousands of stars, though only the brightest few dozen can be seen in this image.

The nebula can be found in the constellation of Sagittarius, and despite being about 5000 light years from Earth can actually be seen with the naked eye from a very dark sight (though you'd be better off with a pair of binoculars). Unfortunately, even with binoculars the nebula doesn't look as red and purple as these images suggest, but more of a greyish colour. The reason for this is that under low light conditions human eyes are not good at distinguishing colours, and so most faint things appear grey.

The reddish hue of the Lagoon Nebula seen in most astronomical images comes from the fact that most of the light we see comes from a bright emission line known as Hα ('H alpha'), which is a very prominent emission line from the element Hydrogen that can be found in the red part of the electromagnetic spectrum (hence why we astronomers colour these images red to reproduce their real colour).

The 'Hourglass Nebula" in the centre of the Lagoon Nebula
The nebula is illuminated by a number of very massive, young stars that ionise the hydrogen in the nebula and cause it to glow. It is amazing to think that this entire nebula, approximately 100 light years across, can be illuminated by just a handful of bright stars - but these stars are really bright!

There's a lot of small scale structures within the nebula that this image reveals, including a number of prominent dust globules that are silhouetted against the bright nebula. Perhaps the most famous structure within the Lagoon Nebula is the Hourglass Nebula at its heart. This is a very dense and compact ionised nebula where stars are still forming and which is being ionised by a very young and still embedded, massive star. The Hourglass nebula was actually discovered by the astronomer John Herschel, son of William Herschel, so it's quite exciting to be studying a region previously studied by such a famous astronomer!

This is all particularly timely because of a recent paper that presents high-resolution Hubble Space Telescope images of the hourglass nebula (see below). These observations are much higher resolution than our VPHAS+ images and they're much more detailed, but they only cover a small part of the entire Lagoon Nebula. That is one of the great advantages of large-scale surveys such as VPHAS+, they cover everything!

The Hourglass Nebula as seen by the Hubble Space Telescope
(Credit: Maiz Apellaniz et al. 2014)
The detail in this image is really impressive, and the authors of the paper have done some interesting science with it, detecting evidence of the massive star Herschel 36 being a binary system amongst other results. All of this makes the Lagoon Nebula a really interesting scientific target, which makes me feel very lucky to be studying it at the moment!

Friday 24 October 2014

Inflatable Solar System

It's been an exciting week because this week I received a package in the post containing a new inflatable Solar System!

I've actually never owned an inflatable Solar System before, but this will be replacing a rather flimsy cardboard Solar System I used to own (yes, you can have a 'cardboard' Solar System!). I have to say that this inflatable one is much better than my previous home-made Solar System, and will probably be much more durable too.

I bought this because I've recently been visiting some schools in my local area to give talks and I needed this model Solar System for one of the activities I do with the school children.

I use this activity to break up the talk and provide some interaction between me and the children. We talk about the different planets and their properties, and then I get some volunteers to come up and pretend to be the Solar System.

Visiting local schools and giving talks to school children is something I love doing because it gives me an opportunity to share my love of astronomy and astrophysics with people. Most people love to hear about science, in particular astronomy, so it can be a really enjoyable experience.

Plus, communicating astronomy with school children encourages them to take up scientific subjects in school and pursue them in college, and a scientifically literate workforce is good for everyone.

Sunday 19 October 2014

The largest astronomical catalogs ever made! (Part II of II)

In a previous post I introduced the 'Top 10' largest astronomical catalogs that are currently and publicly available for astronomers (and anyone) to download and use. For a quick reminder, here's the list:
  1. The US Naval Observatory (USNO-B1) all-sky catalog, 1046 million entries (2003)
  2. The Guide Star Catalog (GSC v2.3) all-sky catalog, 946 million entries (2006)
  3. The Sloan Digital Sky Survey (SDSS DR9), 933 million entries (2012)
  4. The Wide-field Infrared Survey Explorer (WISE) all-sky catalog, 748 million entries (2013)
  5. The United Kingdom Infrared Deep Sky Survey (UKIDSS), 727 million entries (2012)
  6. The 2 Micron All Sky Survey (2MASS), 471 million entries (2003)
  7. The Deep Near Infrared Survey (DENIS) of the southern sky, 355 million entries (2005)
  8. The INT Photometric H-Alpha Survey (IPHAS), 219 million entries (2014)
  9. The USNO CCD Astrograph Catalog v4 (UCAC4), 114 million entries (2012)
  10. The Galactic Legacy Infrared Mid-Plane Survey (GLIMPSE), 104 million entries (2008)
In that post I discussed five of these surveys (including the IPHAS survey that I work on - read more about that here) that all include astronomical objects observed in the visible part of the electromagnetic spectrum (that is the part that we can see with our own eyes). The other five of these surveys all include measurements made outside of this part of the spectrum, and its those I'd like to talk about today.

The electromagnetic spectrum, with wavelength increasing to the right, and frequency (or energy) increasing to the left. (Credit: NASA)

These five surveys are WISE, UKIDSS, 2MASS, DENIS, and GLIMPSE, and they're all infrared photometric surveys, which means they measure how bright astronomical sources are in the infrared. The infrared part of the electromagnetic spectrum includes radiation with a longer wavelength than that of the light we can see, though not as long as microwave radiation or radio waves. You may be aware that infrared radiation is what we commonly know of as heat or warmth. Any object with a temperature around body temperature or up to a few hundred Celsius will radiate energy in the infrared.

Astronomers often divide up the infrared part of the electromagnetic spectrum into the near-, mid- and far-infrared regions, ordered by how far they are from the visible part of the spectrum. The definition of these three regions isn't important, but originates in the different technologies required to detect radiation in each region (such as different CCD detectors).

The near-infrared is the most easily accessible part of the infrared spectrum, and three of these surveys cover this region. Perhaps the most commonly-used of these is 2MASS, an all-sky near-infrared survey, which operated from 1997 to 2001 at two observatories in Arizona and Chile. The 2MASS all-sky view of the Milky Way is a stunning panorama of our galaxy, aided by the ability of near-IR radiation to penetrate the dust that would otherwise absorb optically visible radiation.

The 2MASS all-sky view of the Milky Way (Credit: IPAC)

The DENIS survey was also a deep near-IR survey that finished in 2001, but which only covered the southern sky. The UKIDSS survey(s) are a series of very deep near-IR surveys (deeper than both 2MASS and DENIS) on the United Kingdom Infra-Red Telescope (UKIRT) in Hawaii that targeted certain areas of the sky for different science goals. Some of these areas include regions of our galaxy where stars are forming and other areas look away from our galaxy out into the darkest regions of space where other galaxies are easily studied.

The remaining two surveys, WISE and GLIMPSE, are mid-infrared surveys, operating at slightly longer wavelengths than the near-IR surveys.

The centre of our Milky Way galaxy seen in the mid-infrared from GLIMPSE (Credit: Spitzer GLIMPSE team)

GLIMPSE was a survey of the Milky Way galaxy with NASA's Spitzer Space Telescope, and WISE is also a NASA space telescope that performed an all-sky infrared survey. Because the Earth's atmosphere absorbs most mid-infrared radiation, mid-infrared telescopes have to operate from above the atmosphere.

An artist's impression of NASA's
Spitzer Space Telescope in orbit
(Credit: IPAC)
A further complication for mid-infrared telescopes is that the telescopes themselves have to be cooled to very low temperatures to prevent them from radiating infrared photons themselves! This is because, even in space objects will radiate infrared radiation depending on their temperature. These photons would contaminate the measurements made, and so the entire telescope has to be cooled to incredibly low temperatures, much lower than anything in our solar system, to prevent them from radiating significantly large amounts of infrared radiation. Both space telescopes used cryostats filled with liquid hydrogen to achieve this, allowing them to be cooled to less than -263 C (under 10 K).

That brings our list of the largest astronomical catalogs to a close, for the time being at least. Astronomy is moving ever so rapidly towards bigger and bigger catalogs and it is almost certain that these catalogs will be eclipsed in the near future. The most likely candidates to take the throne of largest astronomical catalog will probably come from either ESA's Gaia satellite or the Large Synoptic Survey Telescope (LSST). More on these in a future post!

Sunday 12 October 2014

The largest astronomical catalogs ever made! (Part I)

In a previous post I discussed a huge data release from one of the surveys I've worked on over the last 10 years, which included a catalog of over 200 million sources. This is a BIG catalog of data, but how does it compare to other large astronomical surveys? I wanted to find out!

To do this I searched the two main astronomical data archives, the Vizier and IRSA online databases. My criteria for including a catalog was that it had to be a single catalog with the same information and measurements made in the same way for all the entries in the catalog (usually referred to as 'sources', because they are the source of the light we are measuring). It could be a catalog of any type of object (stars, planets, galaxies) and it could be from data obtained at any wavelength (optical, infrared, ultraviolet) by any telescope in the world.

So here's the 'Top 10' astronomical catalogs currently (and publicly) available:
  1. The US Naval Observatory (USNO-B1) all-sky catalog, 1046 million entries (2003)
  2. The Guide Star Catalog (GSC v2.3) all-sky catalog, 946 million entries (2006)
  3. The Sloan Digital Sky Survey (SDSS DR9), 933 million entries (2012)
  4. The Wide-field Infrared Survey Explorer (WISE) all-sky catalog, 748 million entries (2013)
  5. The United Kingdom Infrared Deep Sky Survey (UKIDSS), 727 million entries (2012)
  6. The 2 Micron All Sky Survey (2MASS), 471 million entries (2003)
  7. The Deep Near Infrared Survey (DENIS) of the southern sky, 355 million entries (2005)
  8. The INT Photometric H-Alpha Survey (IPHAS), 219 million entries (2014)
  9. The USNO CCD Astrograph Catalog v4 (UCAC4), 114 million entries (2012)
  10. The Galactic Legacy Infrared Mid-Plane Survey (GLIMPSE), 104 million entries (2008)
It's great to see that our survey, IPHAS, has made it into the Top 10! Most of these names probably won't mean much to non-astronomers, but to astronomers these are the big catalogs that many of us use regularly. They represent hundreds of nights of telescope time and thousands of hours of valuable work.

They are primarily (all but one) photometric surveys, which as I mentioned in a previous post is pretty much the easiest measurement an astronomer can make, it's simply a measure of how bright an object is. You don't have to measure the shape of the object, or its exact position, just how bright it is - simply take a picture and 'count' up the amount of light!


Photographic (negative) plate showing the galaxy M33, taken
by Edwin Hubble in 1926 (Credit: University of Arizona)
Interestingly the first two of these catalogs, USNO-B1 and GSC, are compiled not from CCD observations (as are the other photometric catalogs on this list), but from photometry extracted from photographic plates. During the 20th century the night sky was routinely photographed from various observatories around the world and many of the photographic plates have been carefully stored since then in telescope and university archives.

Putting this data together into a single uniform catalog (or two catalogs with heavy overlaps) represents an important and valuable achievement, and this data has been useful for many studies.

These two photographic surveys used photographic plates sensitive to either red or blue light, so both are known as 'optical' surveys (meaning they are sensitive to light in the optical part of the electromagnetic spectrum). The same is also true for three other surveys on this list: SDSS (3rd), IPHAS (8th), and UCAC4 (9th), though these surveys all use CCD observations.

CCDs are superior to photographic plates for many reasons, so why are these modern CCD catalogs smaller than the catalogs compiled from photographic observations? Well this is mostly because the first two of these CCD surveys only covered a small area on the sky: SDSS is focussed on the Galactic halo (where it is easier to observe other galaxies, which was the goal of their survey) and IPHAS covers only the Northern Galactic Plane (the part of our own galaxy visible from the northern hemisphere). Compared to the entire all-sky area of 41,253 square degrees, these two surveys only cover 14,555 and 1800 square degrees, respectively.

The Galactic Plane of our Milky Way galaxy (Credit: Imgur)

The final optical survey, UCAC4, is principally a proper-motion survey and not a photometric survey. The objective here is not to measure how bright the sources are, but how fast the object is moving across the sky (known as its 'proper motion').

The simplest way to do this is to take two images of the same area of the sky separated by a few years. You then measure the positions of all the objects in each image and calculate how far they've moved between the images. In truth it is much more complex than this, because you're measuring objects moving across a curved surface (the sky is a curved surface) and most of our cameras and detectors are not as perfect as we'd like them to be (i.e. a straight line across the sky might not be perfectly straight on the image you record because the optics of the camera might distort it).

Because of these difficulties it isn't always possible to measure a proper motion for every source, hence the reason this catalog is smaller than the other optical all-sky catalogs. Despite these difficulties though this is a very large proper motion catalog and it will be many years before it is eclipsed in terms of size!

Next time we'll look at the other five catalogs on this list, which have all been produced from observations outside of the visible part of the electromagnetic spectrum.

Tuesday 7 October 2014

And the Nobel Prize goes to...

The winners of this year's Nobel Prize in Physics were announced today, and while the award hasn't gone to my first choice, Vera Rubin (or any astrophysicist for that matter), it has gone to a trio of very worthy winners. The winners are Isamu Akasaki, Hiroshi Amano, and Shuji Nakamura for their work in the development of blue LEDs (light emitting diodes).

Why is this so important? Well, it is thought that about 20-30% of the electricity in the world is consumed in electrical lighting, and since LEDs are about 10 times more energy efficient and last about 100 times longer than traditional incandescent light bulbs, the worldwide adoption of LEDs will significantly reduce the world's energy consumption (and therefore its carbon dioxide emission).

So while this wasn't my first choice for the Nobel Prize, it is surely a deserved award!

Sunday 5 October 2014

My nomination for this year's Nobel Prize in Physics

This coming week will bring with it the announcements of the winners of this year's Nobel Prizes, with the physics prize due to be announced on Tuesday.

There has been considerable talk about the Nobel Prize in Physics this year, thanks in part to the announcements coming from the BICEP2 team who claimed to have discovered the tell-tale signature of gravitational waves emitted during an important phase of the early Universe known as inflation. That result has since been questioned by measurements from the PLANCK telescope, so there is unlikely to be a Nobel Prize in the offing for the BICEP2 team this year.

So that leaves the question, who will win the Nobel Prize in Physics this year? There are many strong candidates, and I can't list them all here, but I'd like to mention one strong candidate who I think is very deserving, Vera Rubin.

Vera Rubin (Credit: UC Berkeley)
Vera Rubin was responsible for a number of pioneering observations in the 1960s and 70s that laid down the case for spiral galaxies containing a large mass of undetected matter. The presence of this dark matter was inferred from the rates at which these galaxies were seen to be rotating, which Vera Rubin calculated by measuring the speeds that the stars in the galaxies were moving (using the method I described in a previous post).

Rubin found that the stars at the edges of the galaxies were moving a lot faster than expected if these stars were gravitationally bound to the galaxy, based upon estimates of the mass of the galaxy from counting up all the visible matter (stars, nebulae, and the like). Rubin didn't just find this in one galaxy, but multiple galaxies, leading up to her seminal 1980 paper which presented results for 21 galaxies, all displaying the same pattern of missing mass.

Galaxy rotation curves: predicted (A) versus observed (B).
For the velocities  in (B) to be so much higher than predicted (A) at large distances,
requires a considerable amount of 'missing mass'. (Credit: Penn State University)

Since these pivotal observations there have been two prominent theories to explain these observations (and hundreds more observations since). The first is that the laws of physics (particularly the law of gravity) may somehow be different in these galaxies, which is often referred to as Modified Newtonian Dynamics (MOND). The more popular explanation among astronomers though, is that these galaxies (and our own) contain a large amount of mass that doesn't emit any light, known as dark matter.

Vera Rubin's pioneering work effectively laid down the observational basis for the existence of dark matter. There had been hints of the existence of such matter previously. Both Jan Oort in 1932, Fritz Zwicky in 1933, and Horace Babcock in 1939 had uncovered similar effects, but there were other explanations at the time that meant the results were never conclusive. Rubin's work was both thorough and conclusive, and has certainly stood the test of time.

In fact the evidence for dark matter has improved since that day to the point that the vast majority of astronomers consider it almost a fundamental truth that the majority of the mass in the Universe is in some dark form that we cannot directly observe. There is evidence from studies of hot gas in galaxy clusters, gravitational lensing of background galaxies by foreground dark matter condensations, and even from the cosmic microwave background radiation.

The Bullet Cluster of galaxies. Blue show the distribution of dark matter,
red shows the distribution of 'normal' matter (Credit: NASA).

Perhaps the most direct evidence to date for dark matter comes from observations of the Bullet Cluster of galaxies that shows dark matter and normal baryonic matter spatially separated because of a collision between galaxies. Because the dark matter in the Bullet Cluster is not co-spatial with the distribution of normal matter, these observations cannot be explained by modified theories of gravity.

And now to add to all of this there were hints this year that astronomers might have actually made a direct detection of dark matter!

So with all of this evidence I think Vera Rubin would be highly deserving of a Nobel Prize. Dark matter is the most important astronomical discovery of the last half century, and although we don't fully know what it is made of, we know it exists!

Awarding Vera Rubin a Nobel Prize would also provide an excellent role model for women in all areas of physics. In over a century there have only been two female recipients of the Nobel Prize in Physics, Marie Curie and Maria Goeppert-Mayer, meaning that they are outnumbered 100-1 by male recipients. Adding Vera Rubin to that list would help to reduce that discrepancy, as well as recognising her important work.

Friday 3 October 2014

Searching for stars that run away

So it's observing proposal season and Wednesday was the ESO deadline, which means panicked proposal writing and last-minute scribbling all round.

ESO is the European Southern Observatory, Europe's premier observatory in the southern hemisphere, which operates some of the largest and most advanced telescopes in the world. This includes the four behemoths that make up the VLT, the Very Large Telescope (except there's four of them), each housing a 8.2m mirror and some of the best astronomical instruments in the world.

ESO's Very Large Telescope(s) in Chile (Credit: Wikimedia Commons)

One of the proposals we submitted is part of work by my colleague Mike Mohr-Smith to improve the census of massive stars in our galaxy and identify where they formed. Massive stars are very rare and live very short lives (on astronomical timescales at least), but affect the evolution of other stars and the galaxy as a whole in very important ways. How massive stars form is a major unanswered question in astronomy, and since they live such short lives finding these stars and tracing them back to their birth-sites is an important avenue of research.

So we've recently identified a number of hitherto-undiscovered massive stars in the vicinity of one of the young massive star clusters in our galaxy, Westerlund 2. The most massive stars we know of are nearly always found deep within star clusters, and some people have suggested that they can only form in such environments, so finding massive stars near a massive star cluster, but not within it, is very interesting.

The massive star cluster Westerlund 2 (Credit: Robert Gendler)

So the question arises, did these stars form outside of the cluster (which would make them very special) or did they form in the cluster but have since been ejected? The first step in answering this question is to measure the speed these stars are moving relative to the cluster. If the stars have been ejected (known as runaway stars) they should be moving very fast away from the cluster, but if they formed in isolation their velocities will be much lower.

By taking high resolution spectroscopy of these stars we can measure their speeds by observing the shifts in the positions of known spectral lines due to the Doppler effect. This is the same effect that causes the pitch of a siren to change as a vehicle moves towards you and then away from you, but instead of affecting sound waves it is shifting light waves.

Representation of the Doppler-shift effect on spectral lines
(Credit: University of Virginia)
This image shows a spectrum of light, which is light split into its constituent parts using a prism. What was originally white light has now been split into all the colours of the rainbow (it's actually the same effect that causes a rainbow!).

On top of the rainbow you can see dark lines, which are known as spectral lines. These are caused by atoms of different elements absorbing light at certain wavelengths (in certain parts of the spectrum). When an object is moving away from us, it's light is redshifted, meaning spectral lines shift towards the red part of the spectrum, while when an object is moving towards us it's light is blueshifted, meaning spectral lines shift towards the blue part of the spectrum. The faster an object is moving relative to us, the greater the shift in the position of the spectral lines. So by observing the spectrum of light from a star, measuring the positions of it's spectral lines and comparing them to the positions we know they should be at we can determine how fast the star is moving towards or away from us.

So our objective is to use one of the instruments on the VLT to acquire high-resolution spectroscopy, measure the positions of the spectral lines and therefore the speed the stars are moving relative to the stars in the cluster. With this information we can answer the question of whether these very massive stars formed inside the cluster or outside of the cluster.

That's our plan at least, and that's what we've written to the friendly people at ESO asking them if we can use their telescope to do this project. I'll let you know what they say!

Tuesday 30 September 2014

A new catalogue of over 200 million stars in the Milky Way galaxy

Recently one of the surveys that I'm a member of made a huge data release including over 200 million stars from our own galaxy, the Milky Way. We've made the data available to the entire world, not just the astronomical community, but everyone in the world! Astronomers love to share data!

The Isaac Newton Telescope on La Palma (Credit: ING)

The survey in question is the INT Photometric H-Alpha Survey (IPHAS), which has, over the last 11 years been using the Isaac Newton Telescope on the island of La Palma to survey our own galaxy to an unprecedented level of detail.

IPHAS is a photometric survey, meaning the goal of the survey is to measure photometry for all the sources it observes (astronomers refer to most objects as 'sources' until they're sure exactly what they are: stars, planets or galaxies). Photometry is the easiest measurement astronomers can make, since all you have to do is measure how bright an object is using a certain filter. IPHAS uses two 'broad' filters and one 'narrow' Hα filter (more on the awesomeness of this filter and what you can do with it in a future post).

The Milky Way (Credit: Wikimedia Commons)
Our own galaxy is visible to us as a glowing band of light stretching across the sky, known as the Milky Way. It appears this way to us because we (the Earth, the Sun and the entire solar system) are within the galaxy, and so we see the galaxy all around us, but concentrated in a band of light that makes up the disk of our galaxy. Astronomers refer to this as the Galactic Plane.

Surveying our galaxy is not easy because the stars can often be very crowded together (hence why they often appear blurred as a bright band of light instead of individual stars), so to do the job properly requires a high-resolution telescope and instrument, but also one that could invest a lot of time and effort into a single project such as this.

In 2003 the Isaac Newton Telescope was just such a telescope and so the IPHAS collaboration was born, led by Janet Drew (currently at the University of Hertfordshire where I am also based). I joined the collaboration in 2004 when I started my PhD at University College London and have been involved in the survey ever since, participating in the telescope observations, analysing data, and writing papers. Its been great to be involved in such a large and exciting project such as this.

After 11 years of taking data, sorting and organising the data, and doing some exciting science as well, the catalog is finally finished. It contains information on 219 million detected objects, the vast majority of which are stars in our own galaxy. It's an example of what astronomers (and data scientists) refer to as 'big data': huge catalogs of data, observations and measurements that can be sorted, filtered and analysed en masse.

One example of this is the image shown below, which was put together by IPHAS astronomer Hywel Farnhill. This map shows part of the Galactic Plane that IPHAS has been surveying, mostly covering the constellation of Cygnus, but stretching to Sagitta on the right.

IPHAS stellar density map (Credit: Hywel Farnhill)

This map is a stellar density map, showing the density of stars across the Galactic Plane, i.e. the number of stars detected by the IPHAS survey in each area of the plane, and its really detailed! Click here to see a high-resolution version of the image, zoom into it, and have a look at the exquisite level of detail that can be seen. The brightest parts are where we detect the most stars and the darkest parts are where we detect the least stars.

Most of this structure is actually due to the obscuring effects of interstellar dust, and not actually the distribution of stars in our galaxy (though this does contribute). Interstellar dust, which is mostly very small silicate rocks (similar to those found on Earth), absorbs starlight, particularly at visible wavelengths, and leads to the fine structure that you can see in this image. Tracing the distribution of this dust is really important to astronomers because of the huge influence it can have when it absorbs the light from the stars and galaxies we are trying to study.

You can read more about the survey on the IPHAS website, learn about the data release itself in this published paper by IPHAS astronomer and catalog maestro Geert Barentsen, or read the press release from the Royal Astronomical Society. If you'd like to access the data (and please do) you can get the entire set of data, for free, from the Vizier web archive.

Sunday 28 September 2014

Star formation across Carina and Sagittarius

A stunning image from the European Southern Observatory (ESO) released this week showing a wide-field view of star formation across the Carina-Sagittarius spiral arm.

The image is from the ESO's La Silla Observatory in Chile, which offers unparalleled views of the southern hemisphere's skies thanks to its high elevation in the Andes mountains and low levels of cloud coverage.

Star formation across Carina and Sagittarius (Credit: ESO)

The image shows two prominent star-forming regions: NGC 3603 (left) and NGC 3576 (right), both in the Carina-Sagittarius spiral arm of our galaxy. This spiral arm is the nearest major spiral arm to us as we look towards the centre of our galaxy. The spiral arm spans about a third of the night sky as we see it wrapped around the Galactic Centre, and contains many of the famous star forming regions and nebulae in the night sky.

Interestingly, this area of the spiral arm is the part where the arm curves away from us, causing long stretches of the arm to be superimposed along our sight-line. This means that NGC 3603 is about twice as far away from us as NGC 3576, despite the two regions appearing close to each other on the night sky and appearing as one extended region.

Saturday 27 September 2014

Active star formation in the North American and Pelican Nebulae

Today I thought I'd share some new astronomy results from a recently-published paper I read today. The paper is called "Outflows, Dusty Cores, and a Burst of Star Formation in the North America and Pelican Nebulae" by John Bally and collaborators at the University of Colorado. You may be familiar with the North American (NGC 7000) and Pelican (IC 5070) Nebulae (so-named because they resemble the outline of the North American continent and, supposedly, a pelican), they are two of the most famous night sky nebulae, and visible with a pair of binoculars in the constellation of Cygnus.

The North American (left) and Pelican (centre) Nebulae
(Credit: AstroArn Photography)

These two nebulae are actually part of one much larger complex called W80. Though they might appear to be separated into two (or more regions), this separation is actually caused by an obscuring lane of dust (sometimes referred to as the 'Gulf of Mexico') that lies slightly in the foreground compared to the bright emission nebula (dust absorbs and scatters optically visible light as seen in the image above). The obscuring effect of this dust makes the single large nebula appear like two moderately-sized nebulae.

When seen at infrared wavelengths the absorbing lane and the distinctive shape of the nebula disappears. This is because infrared light is less absorbed by interstellar dust, allowing us to see the true shape of the nebula.

The North American Nebula in infrared light
(Credit: NASA's Spitzer Space Telescope)

The authors of this paper use a wide variety of images of these nebulae taken with different detectors and cameras, and using a variety of filters to capture light at certain wavelengths. This is a common practice in astronomy because some important physical processes only emit light at certain wavelengths, and so imaging a nebula at that wavelength can show you where those processes are taking place. The North American Nebula and Pelican Nebula are most well known from images at optical wavelengths, but these authors also used data at near-infrared wavelengths (including images at 2.12μm, which highlights emission from shocks between colliding gas flows, as shown in the image below) and sub-mm wavelengths (images at a wavelength of 1.1mm).

Infrared 2.12μm image of the Pelican Nebula showing some of the
 shocked regions identified (Credit: Figure 6 from Bally et al. 2014).

Using this data they identified hundreds of shocked regions (see the example above) where flows of gas are colliding. These gas outflows originate from stars that are still in the process of forming and are known as 'Herbig-Haro objects' (named after their discoverers, George Herbig and Guillermo Haro), and can therefore be used to trace active sites of star formation. The authors discovered over 50 such objects, allowing them to trace star formation across the region.

The authors then use their sub-mm images to measure the mass of gas and dust in each of the star-forming clouds that they are studying. This can be done by adding up all the sub-mm light coming from each region and performing some simple calculations.

The authors also introduce a new 'activity index' designed to provide an indication of the level of star forming activity in the cloud. They do this by adding up the number of shocks and outflows in each cloud, and dividing this by the mass of the cloud. This index gives an idea of how much star formation activity is taking place in each cloud, compared to how much star formation it could potentially support (which is dictated by the amount of gas mass in the cloud). A high index shows that there is a considerable amount of star formation taking place in the cloud (compared to that which it could support), while a low value suggests a low amount of star formation (possibly suggesting star formation has yet to start). This is an interesting metric similar to the idea of a 'star formation efficiency' that is often used in large-scale studies of star formation.

You can read about this in more detail by checking out the paper, which is free to read on the astronomy pre-print server arXiv.

Thursday 25 September 2014

Star clusters in the Andromeda Galaxy

Today's APOD (Astronomy Picture of the Day) is a stunning image of the Andromeda Galaxy in which many of the galaxy's star clusters can be seen. This beautiful image comes from the Subaru telescope and shows one of the outer spiral arms of the galaxy. In this image the blue patches are young star clusters containing lots of bright young stars, while regions where stars are forming show up as red blobs (because the dust in these regions reddens the light from them). So this image shows us both the places where stars are forming and the locations of recently formed stars.


This image highlights one of the useful properties of star clusters: because they are so bright we can often see them from a long way away, in this case from 2.5 million light years away, the distance to the nearest spiral galaxy (other than our own Milky Way), Andromeda. This means we can use the young star clusters to map out where stars have recently formed and how many stars have formed (by adding up all the light from the young star clusters). Because in the case of Andromeda we can see the entire galaxy (because the disk is inclined towards us, unlike our Milky Way disk which is edge-on and therefore obscures itself) we can map out the star formation across the entire galaxy.

This is an example of how it can sometimes be easier to map out some process (in this case star formation) across a large area for a distant galaxy than it is for our own Milky Way.

What are star clusters?

What are star clusters? Star clusters are large groups of stars held together by some force, usually the gravitational attraction of all the stars in the cluster.

You may be familiar with two types of star cluster that can be readily observed with the naked eye or a pair of binoculars: open clusters and globular clusters, though there are also other types of cluster such as embedded clusters, young massive clusters, and even slight variants such as OB associations and T associations.

Open clusters may be the most well-known type of cluster because this category includes famous naked-eye examples such as the Pleiades and Hyades clusters. Open clusters are small groups of stars, commonly from a few hundred to a few tens of thousands of members (though there is no fixed upper or lower limit), with ages anywhere from a few tens of Myr (mega-year or 1 million years) up to billions of years (or Gyrs). Open clusters are common in our galaxy, with over a thousand already known, and many are close enough for us to study in detail.

The Pleiades open cluster (Credit: Alson Wong)

Globular clusters on the other hand are very different to open clusters. For a start they are much more massive (in mass as well as in size), containing anything from hundreds of thousands to millions of stars, and appearing considerably more rounder or 'globular' than open clusters. Globular clusters are also much older than open clusters, with typical ages of 12-13 Gyr, similar to age of our galaxy. Furthermore, while open clusters are typically found in the disk of our galaxy (where the majority of current star formation takes place), globular clusters are found in the halo of our galaxy (where star formation might have primarily taken place when our galaxy first formed).

There are about 150 known globular clusters in our galaxy and many more have been found in other galaxies. Some globular clusters are bright and close enough to observe with a pair of binoculars, such as Omega Centauri, the largest known globular cluster in our galaxy.

The Omega Centauri globular cluster (Credit: University of Manchester)

Both open and globular clusters are considered by astronomers to be 'long lived', that is they are thought to be gravitationally stable on long time scales. Clearly globular clusters must be stable for billions of years because they have ages of 12-13 Gyr, though for open clusters the current picture isn't entirely clear. Open clusters have ages up to billions of years, but the majority appear to be quite young with ages of tens or hundreds of Myr, perhaps suggesting that there is a process that disrupts open clusters as they age (I'll come back to this in a future post).

There are also varieties of star cluster that are much younger than typical or open or globular clusters. These are usually divided into two categories: embedded clusters and young massive clusters. The latter appear very similar to the most massive open clusters (containing thousands to tens of thousands of stars) although they are much younger, typically only a few to ten million years old, and therefore contain many massive, but short-lived, stars that are not seen in the older open and globular clusters. The image below shows Westerlund 1, one of the most massive young clusters in our galaxy.

The Westerlund 1 young massive cluster (Credit: Wikimedia commons)

And finally we come to embedded clusters. Like young massive clusters these are also young, with typical ages of up to a few Myrs. Because they are so young these clusters are still embedded within (or on the edge of) the molecular cloud that the stars formed from (I'll discuss how stars form out of clouds of molecular gas in a future post). This leads to an important difference between embedded clusters and other varieties of star cluster. Because the cluster is embedded within a cloud of gas, this gas adds mass to the cluster that can help keep the cluster gravitationally bound (perhaps to the point that the cluster might not be gravitationally bound if it were not embedded within the cloud).

Because embedded clusters are found within molecular clouds, and because the light from all the stars can illuminate and ionise the cloud of gas in the cloud, we often find embedded clusters within some of the famous nebulae in the sky that were discovered in the 17th and 18th centuries.

For example one of the most famous nebulae is the Orion Nebula, which can be seen with the naked eye in the constellation of Orion (surprise!). At the centre of the nebula and illuminating the gas for all to see is a relatively massive cluster of young stars known as the Orion Nebula Cluster. Because of its size and proximity the Orion Nebula Cluster has been very well studied and is one of the most important embedded clusters in all of astronomy.

The Orion Nebula Cluster (Credit: NASA)

Next time you're outside on a clear night, try and find some of these star clusters. You'll need binoculars to see a globular cluster, but open clusters such as the Pleiades or the Hyades are visible to the naked eye, and the even the nebula surrounding the Orion Nebula Cluster can be seen on a clear night!

In a future post I'll discuss the other types of stellar groupings such as OB associations, but for now that covers the main varieties of star cluster.