Tuesday 30 September 2014

A new catalogue of over 200 million stars in the Milky Way galaxy

Recently one of the surveys that I'm a member of made a huge data release including over 200 million stars from our own galaxy, the Milky Way. We've made the data available to the entire world, not just the astronomical community, but everyone in the world! Astronomers love to share data!

The Isaac Newton Telescope on La Palma (Credit: ING)

The survey in question is the INT Photometric H-Alpha Survey (IPHAS), which has, over the last 11 years been using the Isaac Newton Telescope on the island of La Palma to survey our own galaxy to an unprecedented level of detail.

IPHAS is a photometric survey, meaning the goal of the survey is to measure photometry for all the sources it observes (astronomers refer to most objects as 'sources' until they're sure exactly what they are: stars, planets or galaxies). Photometry is the easiest measurement astronomers can make, since all you have to do is measure how bright an object is using a certain filter. IPHAS uses two 'broad' filters and one 'narrow' Hα filter (more on the awesomeness of this filter and what you can do with it in a future post).

The Milky Way (Credit: Wikimedia Commons)
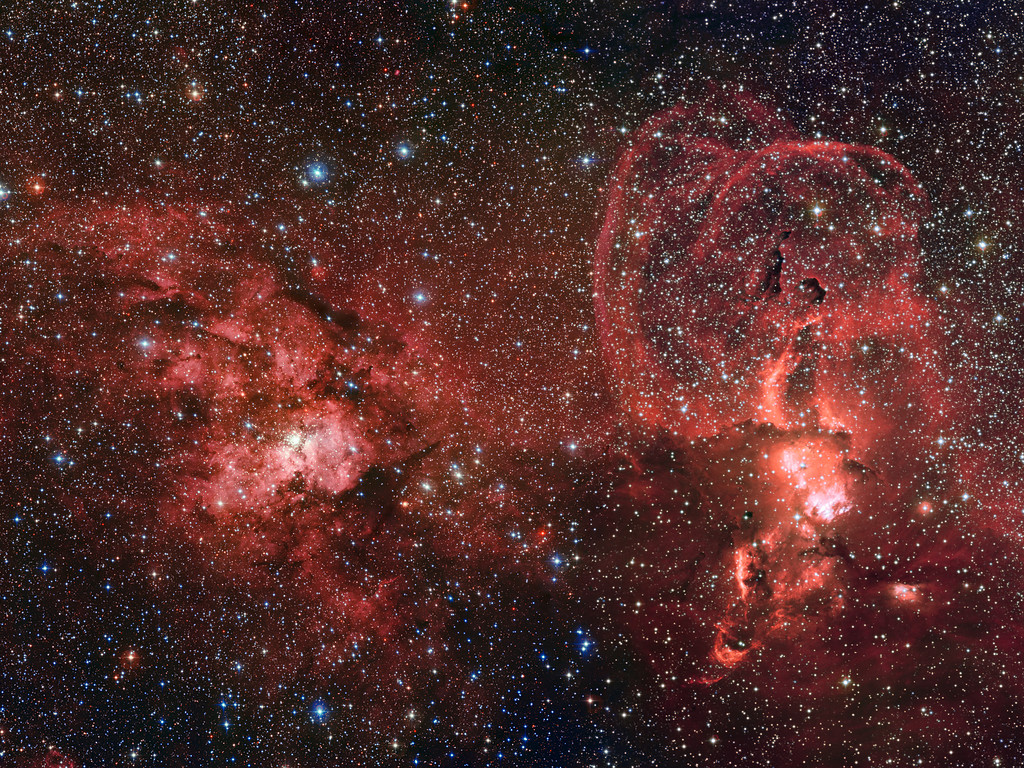
Our own galaxy is visible to us as a glowing band of light stretching across the sky, known as the Milky Way. It appears this way to us because we (the Earth, the Sun and the entire solar system) are within the galaxy, and so we see the galaxy all around us, but concentrated in a band of light that makes up the disk of our galaxy. Astronomers refer to this as the Galactic Plane.

Surveying our galaxy is not easy because the stars can often be very crowded together (hence why they often appear blurred as a bright band of light instead of individual stars), so to do the job properly requires a high-resolution telescope and instrument, but also one that could invest a lot of time and effort into a single project such as this.

In 2003 the Isaac Newton Telescope was just such a telescope and so the IPHAS collaboration was born, led by Janet Drew (currently at the University of Hertfordshire where I am also based). I joined the collaboration in 2004 when I started my PhD at University College London and have been involved in the survey ever since, participating in the telescope observations, analysing data, and writing papers. Its been great to be involved in such a large and exciting project such as this.

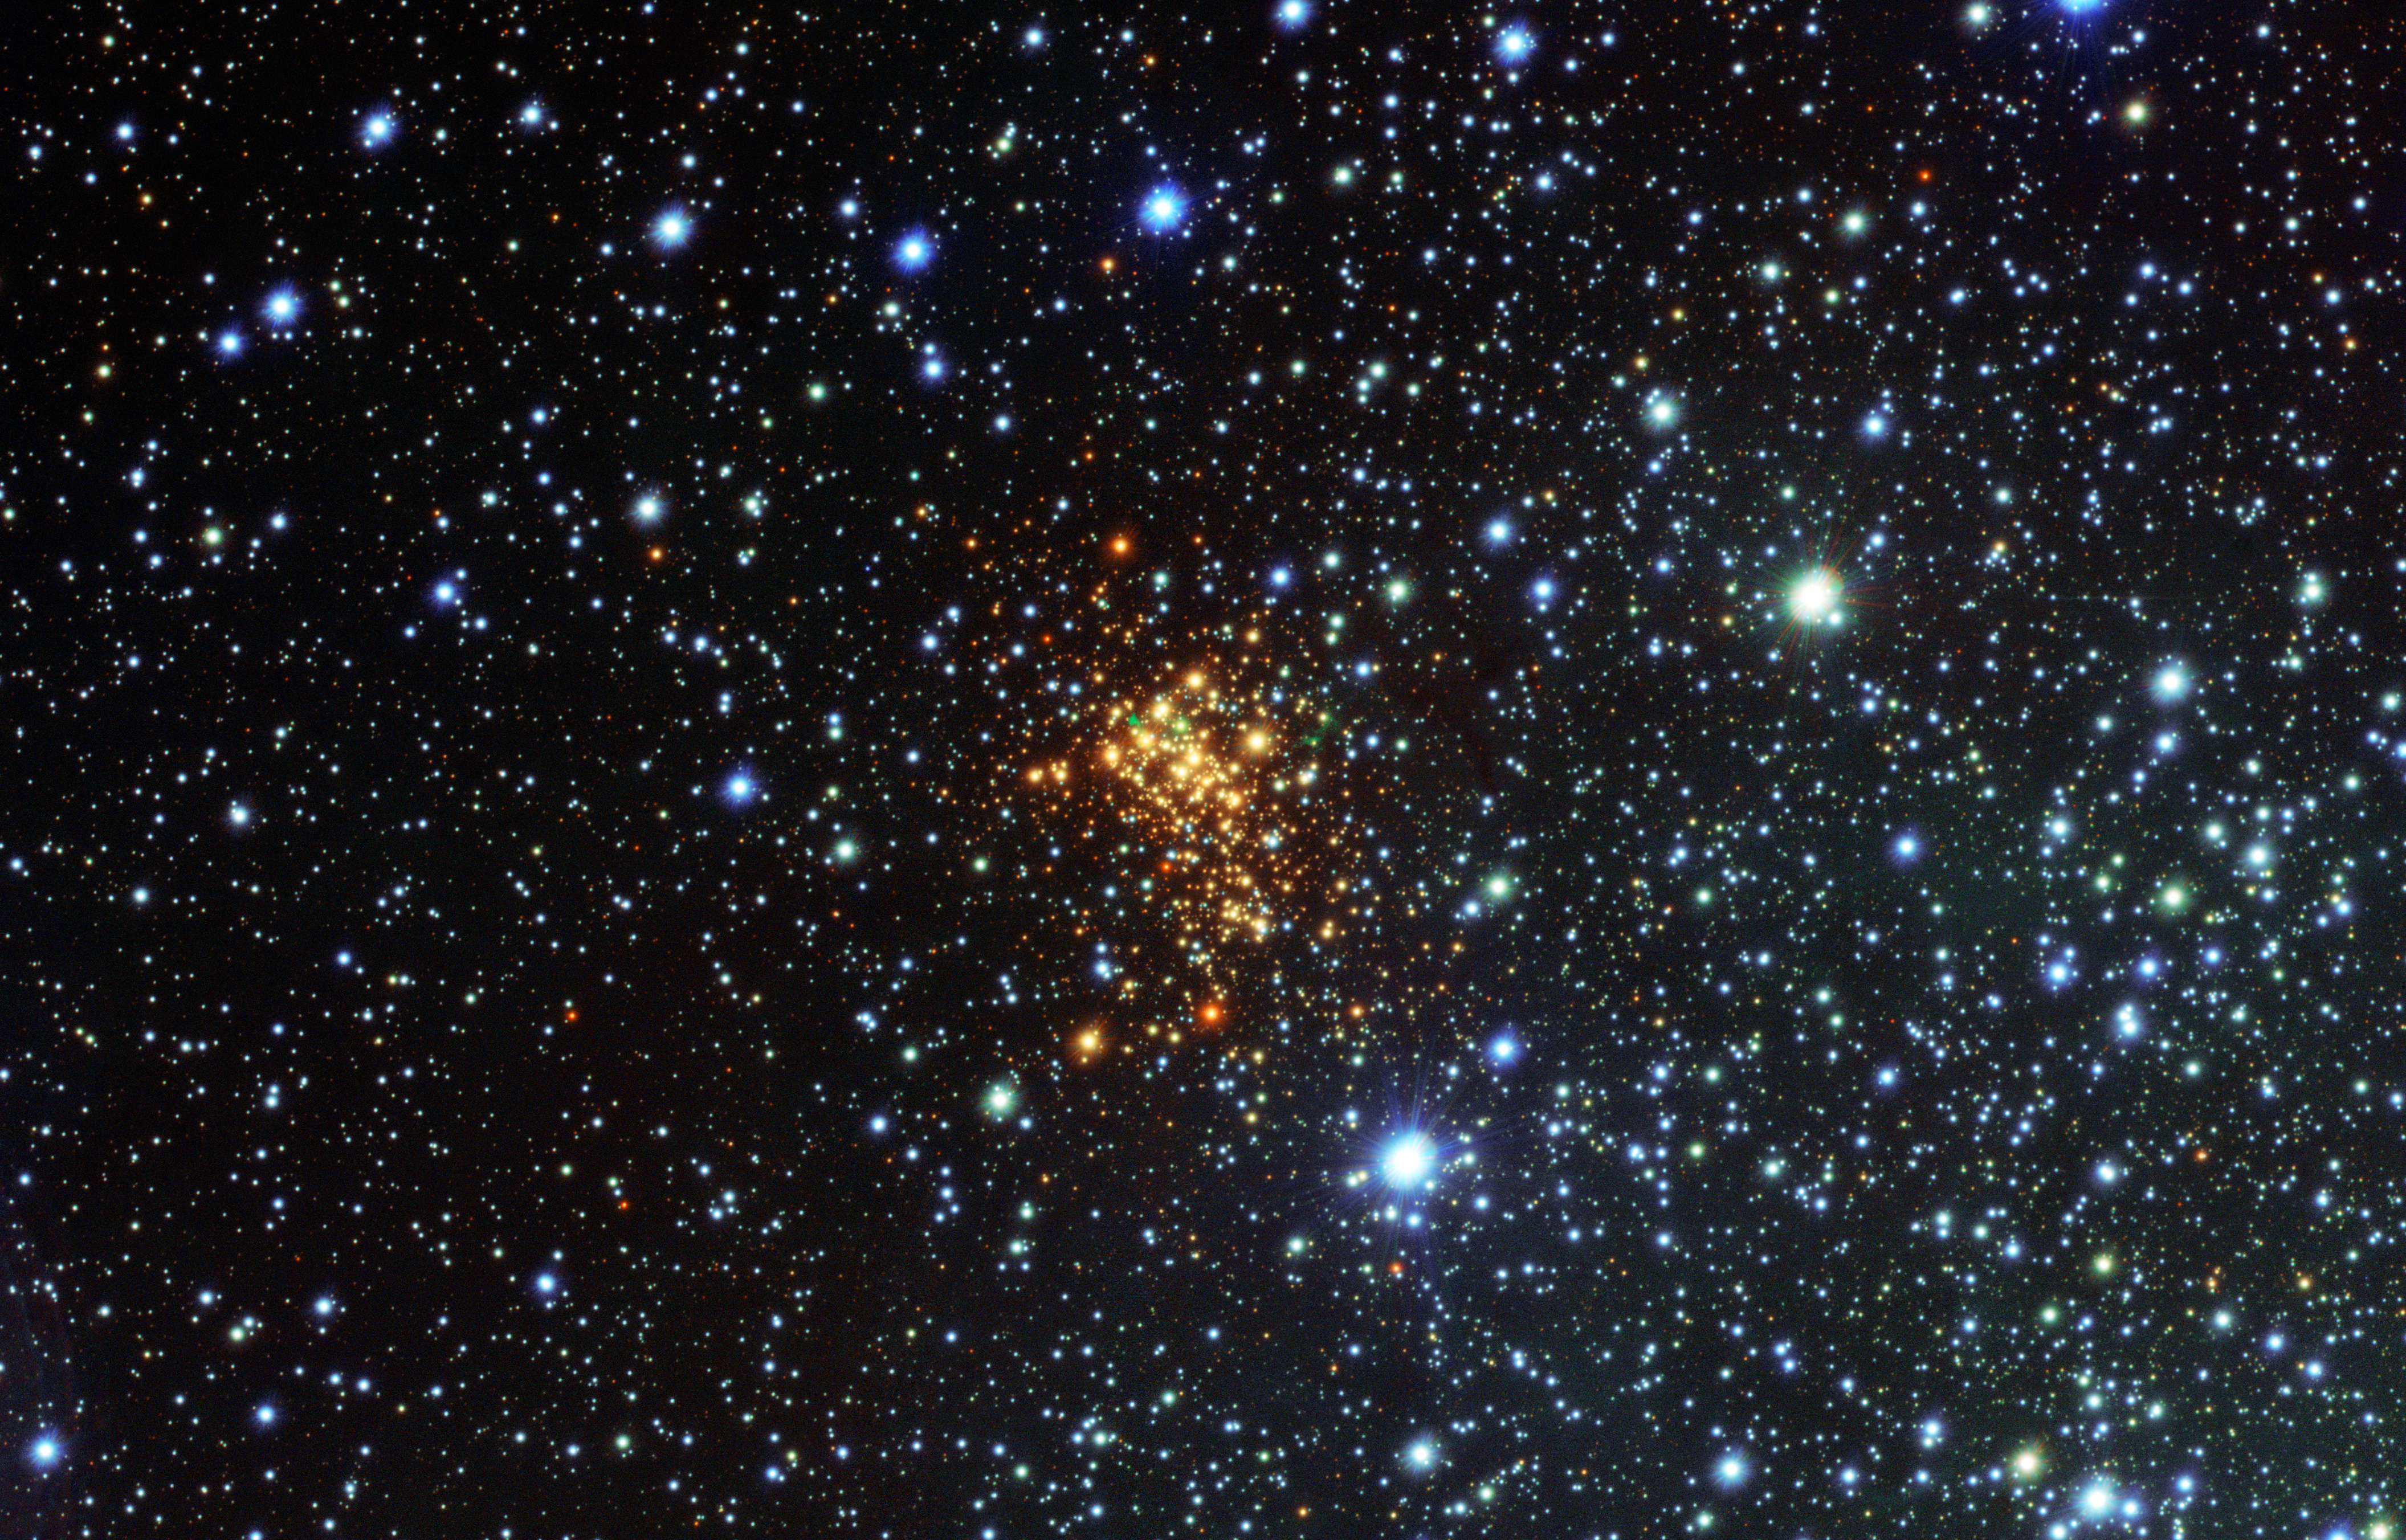
After 11 years of taking data, sorting and organising the data, and doing some exciting science as well, the catalog is finally finished. It contains information on 219 million detected objects, the vast majority of which are stars in our own galaxy. It's an example of what astronomers (and data scientists) refer to as 'big data': huge catalogs of data, observations and measurements that can be sorted, filtered and analysed en masse.

One example of this is the image shown below, which was put together by IPHAS astronomer Hywel Farnhill. This map shows part of the Galactic Plane that IPHAS has been surveying, mostly covering the constellation of Cygnus, but stretching to Sagitta on the right.

IPHAS stellar density map (Credit: Hywel Farnhill)

This map is a stellar density map, showing the density of stars across the Galactic Plane, i.e. the number of stars detected by the IPHAS survey in each area of the plane, and its really detailed! Click here to see a high-resolution version of the image, zoom into it, and have a look at the exquisite level of detail that can be seen. The brightest parts are where we detect the most stars and the darkest parts are where we detect the least stars.

Most of this structure is actually due to the obscuring effects of interstellar dust, and not actually the distribution of stars in our galaxy (though this does contribute). Interstellar dust, which is mostly very small silicate rocks (similar to those found on Earth), absorbs starlight, particularly at visible wavelengths, and leads to the fine structure that you can see in this image. Tracing the distribution of this dust is really important to astronomers because of the huge influence it can have when it absorbs the light from the stars and galaxies we are trying to study.

You can read more about the survey on the IPHAS website, learn about the data release itself in this published paper by IPHAS astronomer and catalog maestro Geert Barentsen, or read the press release from the Royal Astronomical Society. If you'd like to access the data (and please do) you can get the entire set of data, for free, from the Vizier web archive.

Sunday 28 September 2014

Star formation across Carina and Sagittarius

A stunning image from the European Southern Observatory (ESO) released this week showing a wide-field view of star formation across the Carina-Sagittarius spiral arm.

The image is from the ESO's La Silla Observatory in Chile, which offers unparalleled views of the southern hemisphere's skies thanks to its high elevation in the Andes mountains and low levels of cloud coverage.

Star formation across Carina and Sagittarius (Credit: ESO)

The image shows two prominent star-forming regions: NGC 3603 (left) and NGC 3576 (right), both in the Carina-Sagittarius spiral arm of our galaxy. This spiral arm is the nearest major spiral arm to us as we look towards the centre of our galaxy. The spiral arm spans about a third of the night sky as we see it wrapped around the Galactic Centre, and contains many of the famous star forming regions and nebulae in the night sky.

Interestingly, this area of the spiral arm is the part where the arm curves away from us, causing long stretches of the arm to be superimposed along our sight-line. This means that NGC 3603 is about twice as far away from us as NGC 3576, despite the two regions appearing close to each other on the night sky and appearing as one extended region.

Saturday 27 September 2014

Active star formation in the North American and Pelican Nebulae

Today I thought I'd share some new astronomy results from a recently-published paper I read today. The paper is called "Outflows, Dusty Cores, and a Burst of Star Formation in the North America and Pelican Nebulae" by John Bally and collaborators at the University of Colorado. You may be familiar with the North American (NGC 7000) and Pelican (IC 5070) Nebulae (so-named because they resemble the outline of the North American continent and, supposedly, a pelican), they are two of the most famous night sky nebulae, and visible with a pair of binoculars in the constellation of Cygnus.

The North American (left) and Pelican (centre) Nebulae
(Credit: AstroArn Photography)

These two nebulae are actually part of one much larger complex called W80. Though they might appear to be separated into two (or more regions), this separation is actually caused by an obscuring lane of dust (sometimes referred to as the 'Gulf of Mexico') that lies slightly in the foreground compared to the bright emission nebula (dust absorbs and scatters optically visible light as seen in the image above). The obscuring effect of this dust makes the single large nebula appear like two moderately-sized nebulae.

When seen at infrared wavelengths the absorbing lane and the distinctive shape of the nebula disappears. This is because infrared light is less absorbed by interstellar dust, allowing us to see the true shape of the nebula.

The North American Nebula in infrared light
(Credit: NASA's Spitzer Space Telescope)

The authors of this paper use a wide variety of images of these nebulae taken with different detectors and cameras, and using a variety of filters to capture light at certain wavelengths. This is a common practice in astronomy because some important physical processes only emit light at certain wavelengths, and so imaging a nebula at that wavelength can show you where those processes are taking place. The North American Nebula and Pelican Nebula are most well known from images at optical wavelengths, but these authors also used data at near-infrared wavelengths (including images at 2.12μm, which highlights emission from shocks between colliding gas flows, as shown in the image below) and sub-mm wavelengths (images at a wavelength of 1.1mm).

Infrared 2.12μm image of the Pelican Nebula showing some of the
 shocked regions identified (Credit: Figure 6 from Bally et al. 2014).

Using this data they identified hundreds of shocked regions (see the example above) where flows of gas are colliding. These gas outflows originate from stars that are still in the process of forming and are known as 'Herbig-Haro objects' (named after their discoverers, George Herbig and Guillermo Haro), and can therefore be used to trace active sites of star formation. The authors discovered over 50 such objects, allowing them to trace star formation across the region.

The authors then use their sub-mm images to measure the mass of gas and dust in each of the star-forming clouds that they are studying. This can be done by adding up all the sub-mm light coming from each region and performing some simple calculations.

The authors also introduce a new 'activity index' designed to provide an indication of the level of star forming activity in the cloud. They do this by adding up the number of shocks and outflows in each cloud, and dividing this by the mass of the cloud. This index gives an idea of how much star formation activity is taking place in each cloud, compared to how much star formation it could potentially support (which is dictated by the amount of gas mass in the cloud). A high index shows that there is a considerable amount of star formation taking place in the cloud (compared to that which it could support), while a low value suggests a low amount of star formation (possibly suggesting star formation has yet to start). This is an interesting metric similar to the idea of a 'star formation efficiency' that is often used in large-scale studies of star formation.

You can read about this in more detail by checking out the paper, which is free to read on the astronomy pre-print server arXiv.

Thursday 25 September 2014

Star clusters in the Andromeda Galaxy

Today's APOD (Astronomy Picture of the Day) is a stunning image of the Andromeda Galaxy in which many of the galaxy's star clusters can be seen. This beautiful image comes from the Subaru telescope and shows one of the outer spiral arms of the galaxy. In this image the blue patches are young star clusters containing lots of bright young stars, while regions where stars are forming show up as red blobs (because the dust in these regions reddens the light from them). So this image shows us both the places where stars are forming and the locations of recently formed stars.


This image highlights one of the useful properties of star clusters: because they are so bright we can often see them from a long way away, in this case from 2.5 million light years away, the distance to the nearest spiral galaxy (other than our own Milky Way), Andromeda. This means we can use the young star clusters to map out where stars have recently formed and how many stars have formed (by adding up all the light from the young star clusters). Because in the case of Andromeda we can see the entire galaxy (because the disk is inclined towards us, unlike our Milky Way disk which is edge-on and therefore obscures itself) we can map out the star formation across the entire galaxy.

This is an example of how it can sometimes be easier to map out some process (in this case star formation) across a large area for a distant galaxy than it is for our own Milky Way.

What are star clusters?

What are star clusters? Star clusters are large groups of stars held together by some force, usually the gravitational attraction of all the stars in the cluster.

You may be familiar with two types of star cluster that can be readily observed with the naked eye or a pair of binoculars: open clusters and globular clusters, though there are also other types of cluster such as embedded clusters, young massive clusters, and even slight variants such as OB associations and T associations.

Open clusters may be the most well-known type of cluster because this category includes famous naked-eye examples such as the Pleiades and Hyades clusters. Open clusters are small groups of stars, commonly from a few hundred to a few tens of thousands of members (though there is no fixed upper or lower limit), with ages anywhere from a few tens of Myr (mega-year or 1 million years) up to billions of years (or Gyrs). Open clusters are common in our galaxy, with over a thousand already known, and many are close enough for us to study in detail.

The Pleiades open cluster (Credit: Alson Wong)

Globular clusters on the other hand are very different to open clusters. For a start they are much more massive (in mass as well as in size), containing anything from hundreds of thousands to millions of stars, and appearing considerably more rounder or 'globular' than open clusters. Globular clusters are also much older than open clusters, with typical ages of 12-13 Gyr, similar to age of our galaxy. Furthermore, while open clusters are typically found in the disk of our galaxy (where the majority of current star formation takes place), globular clusters are found in the halo of our galaxy (where star formation might have primarily taken place when our galaxy first formed).

There are about 150 known globular clusters in our galaxy and many more have been found in other galaxies. Some globular clusters are bright and close enough to observe with a pair of binoculars, such as Omega Centauri, the largest known globular cluster in our galaxy.

The Omega Centauri globular cluster (Credit: University of Manchester)

Both open and globular clusters are considered by astronomers to be 'long lived', that is they are thought to be gravitationally stable on long time scales. Clearly globular clusters must be stable for billions of years because they have ages of 12-13 Gyr, though for open clusters the current picture isn't entirely clear. Open clusters have ages up to billions of years, but the majority appear to be quite young with ages of tens or hundreds of Myr, perhaps suggesting that there is a process that disrupts open clusters as they age (I'll come back to this in a future post).

There are also varieties of star cluster that are much younger than typical or open or globular clusters. These are usually divided into two categories: embedded clusters and young massive clusters. The latter appear very similar to the most massive open clusters (containing thousands to tens of thousands of stars) although they are much younger, typically only a few to ten million years old, and therefore contain many massive, but short-lived, stars that are not seen in the older open and globular clusters. The image below shows Westerlund 1, one of the most massive young clusters in our galaxy.

The Westerlund 1 young massive cluster (Credit: Wikimedia commons)

And finally we come to embedded clusters. Like young massive clusters these are also young, with typical ages of up to a few Myrs. Because they are so young these clusters are still embedded within (or on the edge of) the molecular cloud that the stars formed from (I'll discuss how stars form out of clouds of molecular gas in a future post). This leads to an important difference between embedded clusters and other varieties of star cluster. Because the cluster is embedded within a cloud of gas, this gas adds mass to the cluster that can help keep the cluster gravitationally bound (perhaps to the point that the cluster might not be gravitationally bound if it were not embedded within the cloud).

Because embedded clusters are found within molecular clouds, and because the light from all the stars can illuminate and ionise the cloud of gas in the cloud, we often find embedded clusters within some of the famous nebulae in the sky that were discovered in the 17th and 18th centuries.

For example one of the most famous nebulae is the Orion Nebula, which can be seen with the naked eye in the constellation of Orion (surprise!). At the centre of the nebula and illuminating the gas for all to see is a relatively massive cluster of young stars known as the Orion Nebula Cluster. Because of its size and proximity the Orion Nebula Cluster has been very well studied and is one of the most important embedded clusters in all of astronomy.

The Orion Nebula Cluster (Credit: NASA)

Next time you're outside on a clear night, try and find some of these star clusters. You'll need binoculars to see a globular cluster, but open clusters such as the Pleiades or the Hyades are visible to the naked eye, and the even the nebula surrounding the Orion Nebula Cluster can be seen on a clear night!

In a future post I'll discuss the other types of stellar groupings such as OB associations, but for now that covers the main varieties of star cluster. 

Wednesday 24 September 2014

So I've decided to start writing a blog about star clusters...

So I've decided to start writing a blog about star clusters!

For those that don't know, I'm a professional astronomer studying star clusters and star formation. That's what I do, 40 hours a week!

OK, not 40 hours a week, I have some teaching to do as well, and I supervise various research students, and I have to do bits and bobs of admin as well.

But most of the time, that's what I do. Research! It's one one the great joys of being a postdoc: I get paid to do research!

So this blog will be about my job studying star clusters, star formation, and stars in general. It'll include news and recent developments in the field, my own research results, and those of other people in the field. It'll probably also include other results and exciting developments in astronomy. I'll try and give you all a view of what life is like as a professional astronomer, the joys of discovery, and the pleasures of science. I'll also try and include some information and background on star clusters so you can learn about these amazing objects that I study!

Anyway, let's get on with it! Welcome!